Are We Getting the Best from Them? — Execution Leverage & Productivity Maturity
Mini-Series: Reporting to the Board — What Every Tech Executive Should Measure (and Why)


Introduction

Photo by Redd Francisco on Unsplash
In the first article of this mini-series, we explored the foundation of every great engineering organization: having the right team.
We looked at talent density, onboarding speed, and capability health — the core signals that tell you whether you have the people to deliver on your ambitions.
But great people alone aren’t enough. Even the strongest team can underperform when systems, tools, or structures get in their way. That’s why the next question every board or founder will ask — explicitly or not — is:
Are you getting the best from them?
This is where execution leverage comes in: how effectively your organization turns effort into impact.
Are We Getting the Best from the Team?
Why it matters
Boards don’t just care about headcount, they care about effectiveness. They want to know whether your team is set up for effectiveness or simply for capacity.
This is about leverage: how well your systems, culture, and leadership practices help people move fast without compromising quality or causing burn out.
In short: are you maximizing the output from the resources you’ve already deployed?
High-performing teams do this through clarity, not control. Let’s look at the right signals to look at to understand whether you are making the most out of your engineering organization.
Signals / metrics to track
Average productivity: contribution rate compared to internal or industry baselines.
Cycle efficiency: time to review, approve, and merge (SDLC flow metrics).
AI engagement: How widely and effectively AI tools are being used to enhance delivery speed and quality.
Work balance: proportion of rework, bug fixes, or interruptions versus planned work.
Developer experience: survey insights, bottlenecks, and satisfaction with tooling.
Focus & productivity time: ratio of deep-work vs. meeting time (calendar telemetry).
Each of these tells a part of the story. Together, they paint a clear picture of organizational health.
From effort to leverage
I’ve been a fan of Software Development Lifecycle (SDLC) metrics for years. In my mind, they’re not about micromanaging, but about clarity: they show how energy moves through the system and where it’s being lost.
Since we adopted Pull Reminders back in 2019 at TravelPerk, I’ve been amazed at how much signal you can extract from the simple observation of how work moves.
Cycle time — from ticket to production — remains one of the cleanest indicators of engineering flow. It connects strategy to execution and shows how quickly your organization turns ideas into value. Organizations who understand the shift from activity to leverage are the ones which will scale sustainably.
AI as a new productivity multiplier
Every company is watching AI adoption, not only in terms of using AI to make products more competitive but also in terms of how team members themselves embrace AI to become more effective in their individual tasks. The resistance from some professionals has been, frankly, unbelievable.
Tracking AI engagement is now a core signal of maturity: it helps identify internal resistance (often driven by habit or uncertainty) to using AI tools, which usually translates into slowed down processes and results.
But tracking adoption alone isn’t enough. The real question is: what’s the impact? (And the ROI) Is AI truly accelerating delivery and quality, or are we just seeing a short-term boost that later turns into more noise — with teams maintaining endless test cases, edge scenarios, and generated code they barely own?
Developer Experience and the SPACE framework
Developer Experience probably deserves an entire article of its own. Perception can be a tricky metric that requires counterbalancing with facts. Engineers can be opinionated, and context and previous experiences’ bias can skew results. It’s common to hear “things used to be better” — especially when a new hire joins from a larger or more mature company and struggles to adapt to a smaller, faster-moving context.
Frameworks like SPACE have helped standardize how we think about satisfaction, collaboration, and flow. I’ve personally implemented these surveys in several occasions, often running them every 3, 6, or 12 months to see how changes in the way of working or tool adoptions affect team perception.
That’s why combining survey data with objective telemetry — real contribution data, review speed, or productive time — gives a balanced, factual view, grounding the conversation to reality.
Focus time and calendar health

Photo by Ben White on Unsplash
As I’ve written before:
If you don’t own your agenda, your agenda will own your life.
As teams scale, calendars fill — stand-ups, syncs, all-hands — and the space for deep work disappears. This affects not only executives, but every member of the engineering organization. I’ve seen companies like Monzo actively redesign their schedules to safeguard deep work, and we implemented similar strategies at TravelPerk. But it is not as simple as carving out 30-minute blocks. Research (see Deep Work, Cal Newport) shows that context switching can take up to 20–30 minutes for the brain to recover focus.
Measuring “calendar health” (the ratio of long focus blocks vs. interruptions) as a meaningful signal for real productivity is a key first step to improve it through meeting culture and focus hygiene measures.
Productivity, shipping, and story points (yes, I hate them too)
I’ll admit it: I hate story points. Deeply.
They were meant to be a communication tool to align expectations — but they’ve become a noisy, inconsistent proxy for time that few teams interpret the same way.
So — we decided to fix that.
At Pensero, we estimate the magnitude and complexity of every contribution automatically, assigning a consistent productivity score. across all companies. Even if it’s imperfect, it’s consistently imperfect, which makes it fair.
This allows us to deliver insightful metrics such as average productivity per member, which aggregated, provide a reliable picture of each team’s productivity capacity.
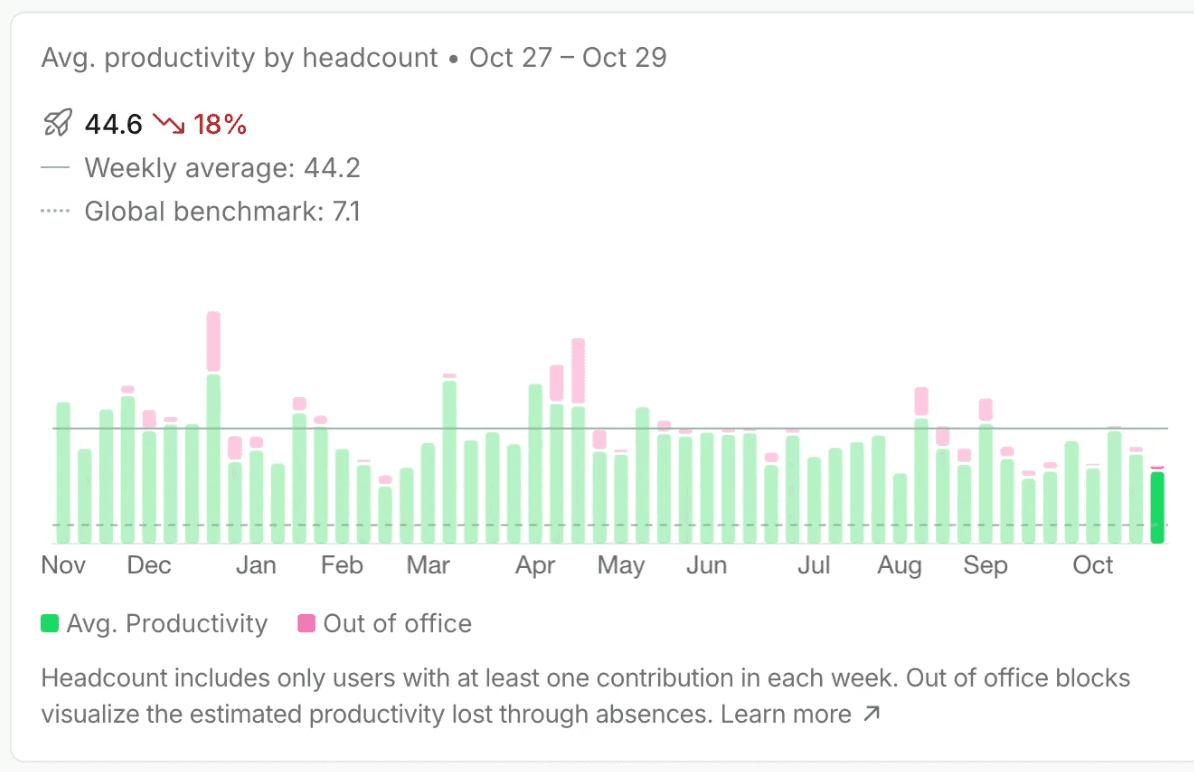
Pensero Average Productivity Trend chart
This approach allows to discover interesting patterns such as:
Remote vs. hybrid vs. on-site teams.
Differences across disciplines (frontend, backend, DevOps, mobile).
The impact of onboarding — how much new hires temporarily affect team throughput.
How long it takes for a reorganized team to reach a performing stage (Tuckman’s model).
Pensero also provides baselines by level, team, and globally, so you can understand how your organization compares to similar peers.
We’re also developing measures for productive time percentage, to help you correlate productivity with focus availability.
Our goal is to integrate existing research data — for example, identifying what constitutes a “productive slot” of focus time — and offer reliable baselines for productivity, focus time, and AI adoption.
Combined with SPACE data, this closes the loop between sentiment and reality, resulting in a holistic, data-backed view of how engineering teams truly perform.
Closing note
Productivity shouldn’t be a weapon. It’s a mirror.
The goal isn’t to control how engineers spend time, but to reveal and understand where the system wastes energy and help teams recover it.
When you optimize for clarity, autonomy, and leverage, you don’t just get more output; you get better engineering.
What’s next
Once you know your team is strong and enabled to perform at their best, the next question becomes focus.
Are we working on the right things?
In the next article, we’ll look at how to connect engineering effort to business outcomes — aligning your team’s work with company priorities, avoiding waste, and keeping strategy and execution in sync.
If you’ve ever struggled to understand your team’s data through spreadsheets or fragmented tools that only rely on ticket lifecycles or member surveys — stay tuned. We’re building something for you.
And if you want to join a blue-ocean opportunity — and help shape how engineering teams navigate this new technology age — check out our careers page.
