The Intelligence behind Agentic Deployment

The Intelligence behind Agentic Deployment

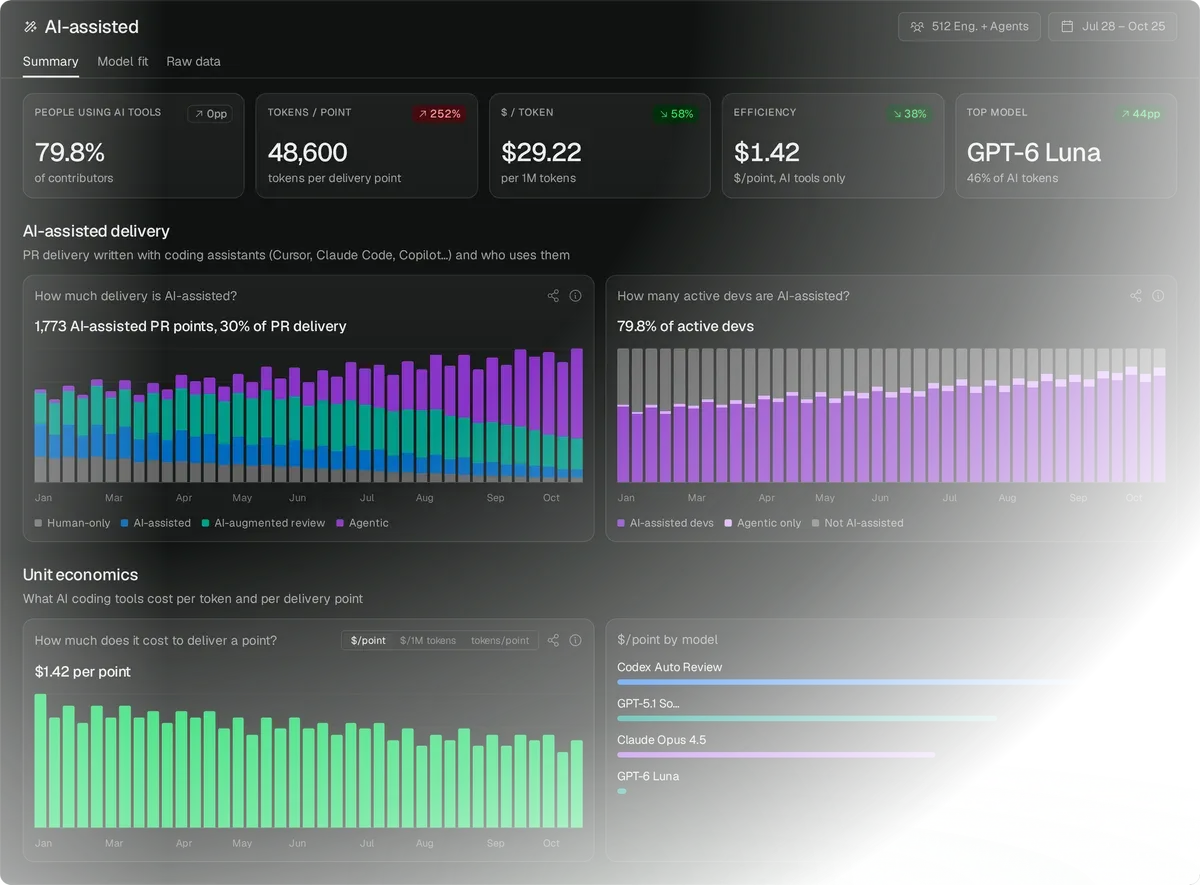
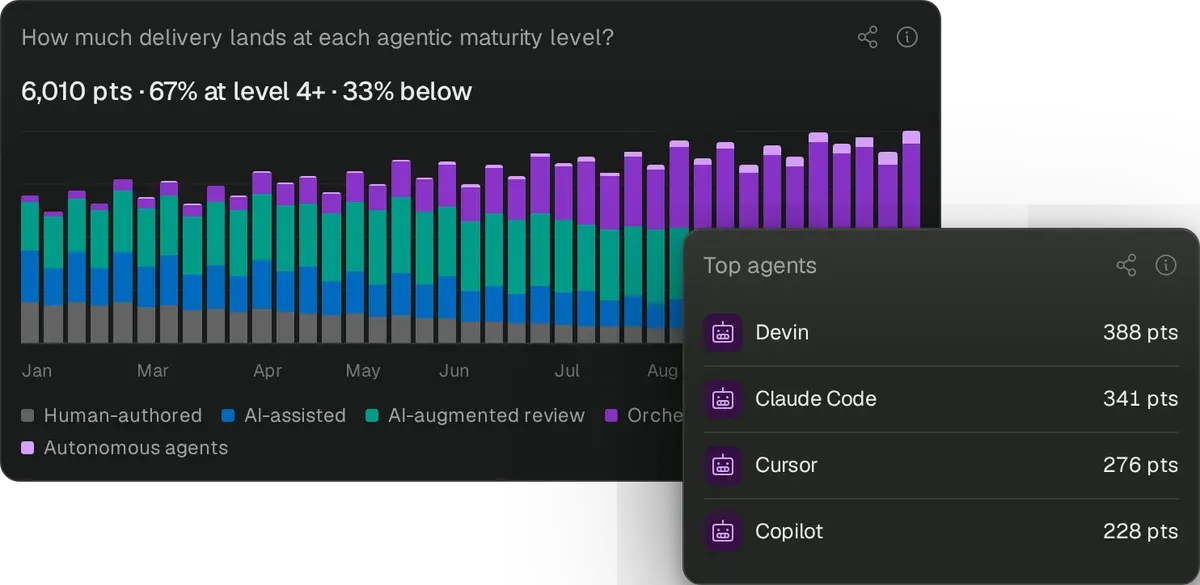
Agent performance

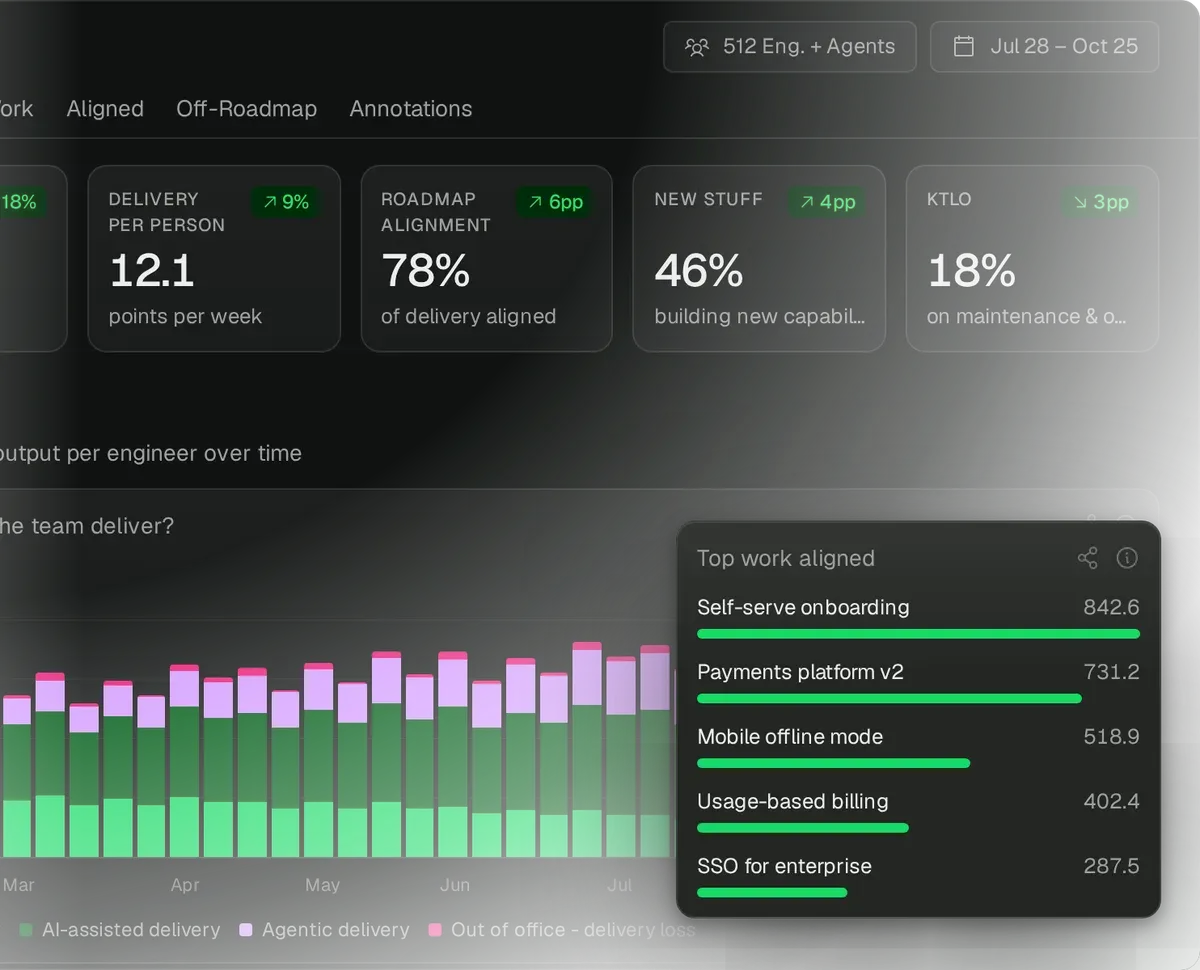
Cost per unit of work

Agentic transformation monitoring

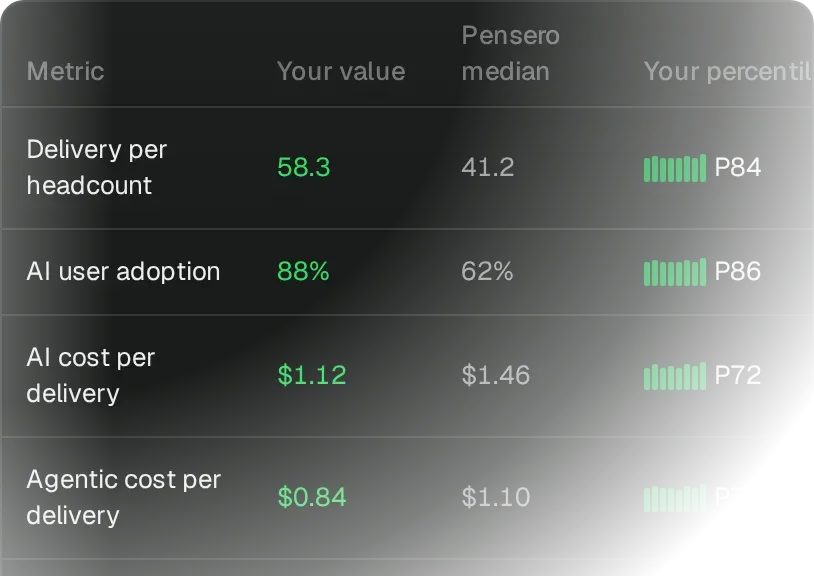
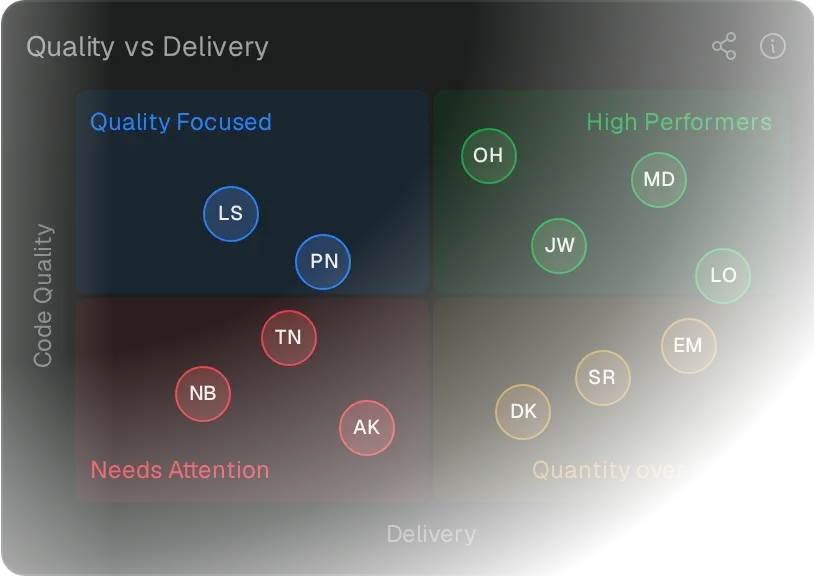
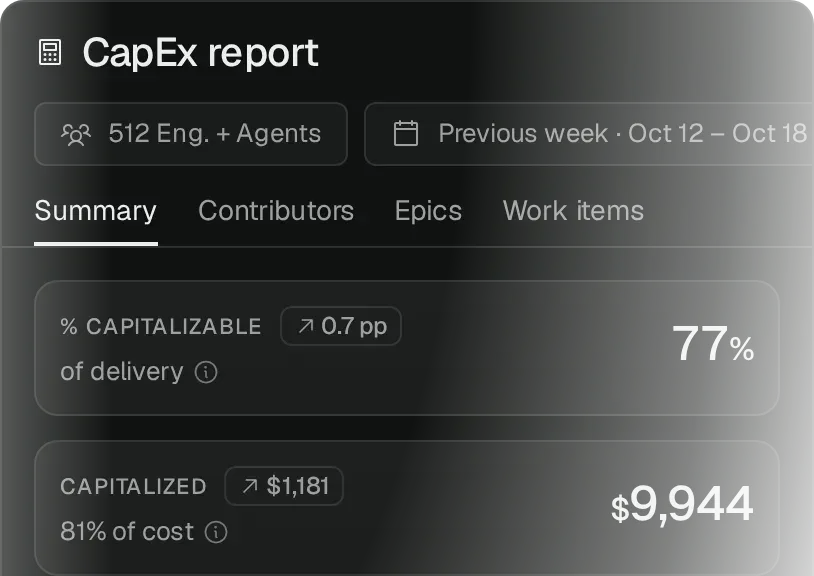
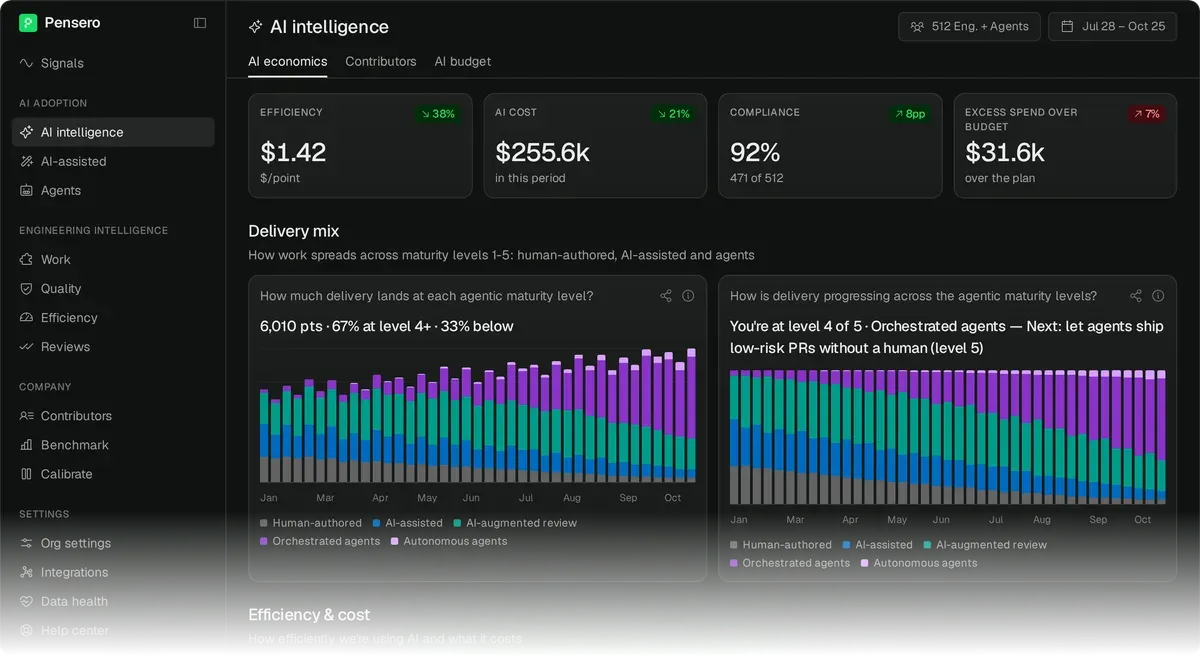
Pensero helps you choose the best and most efficient combination of humans and agents that yields the most effective output.

Pensero helps you choose the best and most efficient combination of humans and agents that yields the most effective output.

Pensero helps you choose the best and most efficient combination of humans and agents that yields the most effective output.

pensero.ai/dashboard

Pensero
Engineering teams
Intelligence
Signals
Scope of work
Delivery
Collaboration
Quality
Efficiency
AI impact
Talent
Company
CapEx
Benchmark
Calibrate
Teams
People
Good morning, Emeryยท Delivery, Quality, and AI efficiency are exceeding expectations this quarter
Delivery
Exceeding
6,155
total pts, QTD
58% vs prev. period
Scope of work
Watch
32.1%
aligned with roadmap
3% vs prev. period
Quality
Watch
12.4%
defect rate this period
+3.2% vs prev. period
AI efficiency
Exceeding
$0.78
cost per delivery point
12% vs prev. period
AI-assisted PRs drive 82% of delivery
1,859 pts shipped with agents this quarter
NovDecJanFebMarAprMay
PR deliveryRevertedAgent adoption
Rework rising alongside agent adoption
From 8.2% โ†’ 12.4% defect rate since Nov
NovDecJanFebMarAprMay
DefectsReworkAgent adoption
Agent
Tech
Global
$/pt
Avg. daily
CC
Claude Code
Agent ยท Anthropic
Python/TS
96%
$0.42
22.4
D
Devin
Agent ยท Cognition
Python
89%
$0.71
18.1
C
Cursor
AI-assisted ยท Anysphere
TypeScript
94%
$0.58
15.7
GC
GitHub Copilot
AI-assisted ยท GitHub
Python
91%
$0.63
12.3
GC
Gemini Code Assist
AI-assisted ยท Google
Python/Go
93%
$0.55
14.2
Team vs. benchmark
How your org compares ยท Q to date
Delivery / cost
93th
Agent-delivered code
95th
Autonomous delivery
80th
Defect rate
50th
Innovation rate
27th
Roadmap alignment
17th

pensero.ai/dashboard

Pensero
Engineering teams
Intelligence
Signals
Scope of work
Delivery
Collaboration
Quality
Efficiency
AI impact
Talent
Company
CapEx
Benchmark
Calibrate
Teams
People
Good morning, Emeryยท Delivery, Quality, and AI efficiency are exceeding expectations this quarter
Delivery
Exceeding
6,155
total pts, QTD
58% vs prev. period
Scope of work
Watch
32.1%
aligned with roadmap
3% vs prev. period
Quality
Watch
12.4%
defect rate this period
+3.2% vs prev. period
AI efficiency
Exceeding
$0.78
cost per delivery point
12% vs prev. period
AI-assisted PRs drive 82% of delivery
1,859 pts shipped with agents this quarter
NovDecJanFebMarAprMay
PR deliveryRevertedAgent adoption
Rework rising alongside agent adoption
From 8.2% โ†’ 12.4% defect rate since Nov
NovDecJanFebMarAprMay
DefectsReworkAgent adoption
Agent
Tech
Global
$/pt
Avg. daily
CC
Claude Code
Agent ยท Anthropic
Python/TS
96%
$0.42
22.4
D
Devin
Agent ยท Cognition
Python
89%
$0.71
18.1
C
Cursor
AI-assisted ยท Anysphere
TypeScript
94%
$0.58
15.7
GC
GitHub Copilot
AI-assisted ยท GitHub
Python
91%
$0.63
12.3
GC
Gemini Code Assist
AI-assisted ยท Google
Python/Go
93%
$0.55
14.2
Team vs. benchmark
How your org compares ยท Q to date
Delivery / cost
93th
Agent-delivered code
95th
Autonomous delivery
80th
Defect rate
50th
Innovation rate
27th
Roadmap alignment
17th

Measuring the agentic workforce at fast-growing companies around the world

The Pensero Intelligence

The Intelligence that helps you choose the best
and most efficient combination of humans and agents

The Intelligence that helps you choose the best and most efficient combination of humans and agents

Objective visibility into every agentic contribution.

The Pensero Intelligence

The Intelligence that helps you choose the best and most efficient combination of humans and agents

Objective visibility into every agentic contribution.

User adoption
92%
236 of 257 engineers
12 devs this quarter
AI cost
$4,425
extra spend, quarter to date
25% from last quarter
Token efficiency
4.2k
tokens per delivery point
Defect rate
1.8%
of total delivery
10.6pp improvement
Token efficiency improving every week
โ†“ 4,218 tokens / pt today vs 10k+ in Nov
NovDecJanFebMarAprMay
Tokens per delivery point
AI spend stays lean as adoption scales
$4,425 total ยท $101.71 per engineer
NovDecJanFebMarAprMay
Weekly AI usage cost
AI-assisted PRs now drive 82% of delivery
1,859 pts shipped with AI this quarter
NovDecJanFebMarAprMay
PR deliveryOOO lossAI-assisted trend
Defects shrinking as AI usage rises
From 12.4% โ†’ 1.8% defect rate since Nov
NovDecJanFebMarAprMay
Defect costBug fixingAI adoption
Total delivery
Exceeding
9,612
points shipped, QTD
+18% vs prev. period
Per headcount
Exceeding
54.0
avg pts per engineer
7.2ร— benchmark
PRs merged
Exceeding
2,847
across 178 engineers, QTD
+22% vs prev. period
Focus time
Watch
72%
of work week in deep work
-3% vs prev. period
Delivery velocity climbing across the org
9,612 pts this quarter, +18% vs prior period
NovDecJanFebMarAprMay
DeliveryOOO lossPer HC trend
What delivery looks like
By contribution type, QTD
Pull requests
62.0%
Tickets
24.0%
Documents
9.0%
Communications
5.0%
2,847 pull requests merged ยท 1,204 tickets closed
Work
Epic
Team
Contributors
Pts
Integrate SSO with org-level alerts
Improvement
Auth & SSO
Engineering
MJ
SD
44.2
Attribute usage data to billing segments
Improvement
Billing
Engineering
CM
BL
39.5
OAuth token refresh failing on reconnect
KTLO
โ€”
Engineering
PS
AK
SD
21.1
Support multi-region deployment config
New
Infrastructure
Platform
BL
MJ
19.6
Refactor webhook retry pipeline
Improvement
Integrations
Eng, Product
CM
PS
17.8
Team
Pts
/HC
Core Engineering
8,24046.3
Product & Design
74853.4
Platform
38664.3
Infrastructure
16254.0
Data
7638.0
How does your organization compare?
ยท Quarter to date, Apr 01 โ€“ May 14
Delivery per headcount
93th
AI-assisted code
95th
Innovation rate
27th
Cycle time
56th
Talent density
84th
Defect rate
50th
Collaboration
80th
Roadmap alignment
17th
Capitalizable
53th
Knowledge gaps
73th
Top 7% in delivery โ€” and climbing
93rd
Avg. weekly delivery points per active developer
DecJanFebMarAprMay
95th percentile in AI adoption across the industry
95th
Share of merged code that was AI-assisted
DecJanFebMarAprMay
Collaboration score in the top 20% globally
80th
Share of delivery spent on collaboration and enablement
DecJanFebMarAprMay
Knowledge gaps closing fast
73rd
Knowledge gap index across active engineering teams
DecJanFebMarAprMay
Code quality is the best it's ever beenยท Quarter to date, Apr 01 โ€“ May 15
Defect rate
Exceeding
1.8%
of delivery this quarter
2.6ร— better than global benchmark 4.7
Defect-free code
Exceeding
98.2%
of shipped code has zero defects
51.8% improvement vs prev. period
Code coverage
Exceeding
88.6%
across 462 PRs ยท weekly avg 69.0%
19.6 pts above the weekly average
Rework rate
Watch
1.2%
28.6 pts rewritten this period
Dec and Mar spikes now resolved
Defect rate at an all-time low this quarter
1.8% (41.9 pts) of delivery had defects ยท global benchmark 4.7
NovDecJanFebMarAprMay
Defect costBug fixingDefect cost %
Rework at its lowest โ€” 1.2% this quarter
1.2% (28.6 pts) of delivery was rewritten ยท weekly avg 1.7
NovDecJanFebMarAprMay
ReworkRework %
Delivery and quality mapped across every contributor
Quality score vs. delivery output ยท active contributors, Apr 01 โ€“ May 15
0%25%50%75%100%0%25%50%75%100%Delivery →Quality →Quality focusedHigh performersNeeds attentionQuantity over qualityMCYGFAARIPRLJSDSMDDGPN
High performersOther quadrants
Capitalizable
Exceeding
78.1%
of total delivery, QTD
up 9.8 pts vs prev. period
Capitalizable value
Exceeding
$1.37M
attributable salary, QTD
+12.3% vs prev. period
Total comp tracked
$1.76M
across 178 engineers, QTD
100% attribution coverage
Non-capitalizable
Watch
$388K
operations & maintenance
+2.1% vs prev. period
Capitalizable share rising every quarter
From 62% โ†’ 78.1% cap rate since November
NovDecJanFebMarAprMay
CapitalizableNon-capitalizableCap % trend
Where the value goes
By work category, QTD
Capitalizable ยท $1.37M
New features
$862K
Improvements
$508K
Non-capitalizable ยท $388K
KTLO
$221K
Performance
$126K
Other
$41K
Epic
% cap
Cap. value
Multi-tenant SSO integration
100%
$168.2K
Usage-based billing engine
100%
$124.6K
Customer onboarding redesign
94%
$116.3K
API rate limiter & throttling
71%
$93.1K
Webhook event delivery system
100%
$78.8K
Employee
% cap
Cap. value
MJ
Marcus Johnson
99.1%
โ€”
SD
Sophie Durand
96.9%
$12.8K
CM
Carlos Medina
94.2%
$12.6K
PS
Priya Sharma
93.1%
$12.4K
BL
Bryan Lee
89.5%
$11.9K
User adoption
92%
236 of 257 engineers
12 devs this quarter
AI cost
$4,425
extra spend, quarter to date
25% from last quarter
Token efficiency
4.2k
tokens per delivery point
Defect rate
1.8%
of total delivery
10.6pp improvement
Token efficiency improving every week
โ†“ 4,218 tokens / pt today vs 10k+ in Nov
NovDecJanFebMarAprMay
Tokens per delivery point
AI spend stays lean as adoption scales
$4,425 total ยท $101.71 per engineer
NovDecJanFebMarAprMay
Weekly AI usage cost
AI-assisted PRs now drive 82% of delivery
1,859 pts shipped with AI this quarter
NovDecJanFebMarAprMay
PR deliveryOOO lossAI-assisted trend
Defects shrinking as AI usage rises
From 12.4% โ†’ 1.8% defect rate since Nov
NovDecJanFebMarAprMay
Defect costBug fixingAI adoption
Total delivery
Exceeding
9,612
points shipped, QTD
+18% vs prev. period
Per headcount
Exceeding
54.0
avg pts per engineer
7.2ร— benchmark
PRs merged
Exceeding
2,847
across 178 engineers, QTD
+22% vs prev. period
Focus time
Watch
72%
of work week in deep work
-3% vs prev. period
Delivery velocity climbing across the org
9,612 pts this quarter, +18% vs prior period
NovDecJanFebMarAprMay
DeliveryOOO lossPer HC trend
What delivery looks like
By contribution type, QTD
Pull requests
62.0%
Tickets
24.0%
Documents
9.0%
Communications
5.0%
2,847 pull requests merged ยท 1,204 tickets closed
Work
Epic
Team
Contributors
Pts
Integrate SSO with org-level alerts
Improvement
Auth & SSO
Engineering
MJ
SD
44.2
Attribute usage data to billing segments
Improvement
Billing
Engineering
CM
BL
39.5
OAuth token refresh failing on reconnect
KTLO
โ€”
Engineering
PS
AK
SD
21.1
Support multi-region deployment config
New
Infrastructure
Platform
BL
MJ
19.6
Refactor webhook retry pipeline
Improvement
Integrations
Eng, Product
CM
PS
17.8
Team
Pts
/HC
Core Engineering
8,24046.3
Product & Design
74853.4
Platform
38664.3
Infrastructure
16254.0
Data
7638.0
How does your organization compare?
ยท Quarter to date, Apr 01 โ€“ May 14
Delivery per headcount
93th
AI-assisted code
95th
Innovation rate
27th
Cycle time
56th
Talent density
84th
Defect rate
50th
Collaboration
80th
Roadmap alignment
17th
Capitalizable
53th
Knowledge gaps
73th
Top 7% in delivery โ€” and climbing
93rd
Avg. weekly delivery points per active developer
DecJanFebMarAprMay
95th percentile in AI adoption across the industry
95th
Share of merged code that was AI-assisted
DecJanFebMarAprMay
Collaboration score in the top 20% globally
80th
Share of delivery spent on collaboration and enablement
DecJanFebMarAprMay
Knowledge gaps closing fast
73rd
Knowledge gap index across active engineering teams
DecJanFebMarAprMay
Code quality is the best it's ever beenยท Quarter to date, Apr 01 โ€“ May 15
Defect rate
Exceeding
1.8%
of delivery this quarter
2.6ร— better than global benchmark 4.7
Defect-free code
Exceeding
98.2%
of shipped code has zero defects
51.8% improvement vs prev. period
Code coverage
Exceeding
88.6%
across 462 PRs ยท weekly avg 69.0%
19.6 pts above the weekly average
Rework rate
Watch
1.2%
28.6 pts rewritten this period
Dec and Mar spikes now resolved
Defect rate at an all-time low this quarter
1.8% (41.9 pts) of delivery had defects ยท global benchmark 4.7
NovDecJanFebMarAprMay
Defect costBug fixingDefect cost %
Rework at its lowest โ€” 1.2% this quarter
1.2% (28.6 pts) of delivery was rewritten ยท weekly avg 1.7
NovDecJanFebMarAprMay
ReworkRework %
Delivery and quality mapped across every contributor
Quality score vs. delivery output ยท active contributors, Apr 01 โ€“ May 15
0%25%50%75%100%0%25%50%75%100%Delivery →Quality →Quality focusedHigh performersNeeds attentionQuantity over qualityMCYGFAARIPRLJSDSMDDGPN
High performersOther quadrants
Capitalizable
Exceeding
78.1%
of total delivery, QTD
up 9.8 pts vs prev. period
Capitalizable value
Exceeding
$1.37M
attributable salary, QTD
+12.3% vs prev. period
Total comp tracked
$1.76M
across 178 engineers, QTD
100% attribution coverage
Non-capitalizable
Watch
$388K
operations & maintenance
+2.1% vs prev. period
Capitalizable share rising every quarter
From 62% โ†’ 78.1% cap rate since November
NovDecJanFebMarAprMay
CapitalizableNon-capitalizableCap % trend
Where the value goes
By work category, QTD
Capitalizable ยท $1.37M
New features
$862K
Improvements
$508K
Non-capitalizable ยท $388K
KTLO
$221K
Performance
$126K
Other
$41K
Epic
% cap
Cap. value
Multi-tenant SSO integration
100%
$168.2K
Usage-based billing engine
100%
$124.6K
Customer onboarding redesign
94%
$116.3K
API rate limiter & throttling
71%
$93.1K
Webhook event delivery system
100%
$78.8K
Employee
% cap
Cap. value
MJ
Marcus Johnson
99.1%
โ€”
SD
Sophie Durand
96.9%
$12.8K
CM
Carlos Medina
94.2%
$12.6K
PS
Priya Sharma
93.1%
$12.4K
BL
Bryan Lee
89.5%
$11.9K

Featured

pensero mcp

Your engineering intelligence,
now queryable.

Query your live Pensero data straight from Claude, ChatGPT or any MCP-compatible assistant. Ask about agent performance, cost per unit of work, quality or benchmarks in plain language.

Pensero MCPconnected
Claude

Featured

pensero mcp

Your engineering intelligence,
now queryable.

Query your live Pensero data straight from Claude, ChatGPT or any MCP-compatible assistant. Ask about agent performance, cost per unit of work, quality or benchmarks in plain language.

Pensero MCPconnected
Claude

30%

Average increase
in delivered output

25%

Reduction in agent spend
that produced nothing

60%

60%

Improvement in cost
per unit of delivered work

Agent budgets are approved on promise today. Pensero turns them into a portfolio with a return.

Customer stories

Loved by high-performing teams

Loved by high-performing teams

What changed when output became measurable: in their words, with their numbers.

Customer stories

Loved by high-performing teams

What changed when output became measurable: in their words, with their numbers.

  • "Pensero is story points after the fact. With Pensero we go 4x faster."

    Andrew Eye

    CEO and Founder at ClosedLoop

  • "Itโ€™s a way to sit with an engineer and show them everything theyโ€™ve done, and learn from it."

    Ignasi Vegas

    CEO and Co-founder at Cubbo

  • "Pensero is my compass for knowing where the team is headed.โ€

    Jordi Mirรณ

    CTO at Zynap

  • โ€œFinally a tool that truly increases velocity."

    Nick Traylor

    Head of Engineering at Stord

  • "Pensero is story points after the fact. With Pensero we go 4x faster."

    Andrew Eye

    CEO and Founder at ClosedLoop

  • "Itโ€™s a way to sit with an engineer and show them everything theyโ€™ve done, and learn from it."

    Ignasi Vegas

    CEO and Co-founder at Cubbo

  • "Pensero is my compass for knowing where the team is headed.โ€

    Jordi Mirรณ

    CTO at Zynap

  • โ€œFinally a tool that truly increases velocity."

    Nick Traylor

    Head of Engineering at Stord

  • "Pensero is story points after the fact. With Pensero we go 4x faster."

    Andrew Eye

    CEO and Founder at ClosedLoop

  • "Itโ€™s a way to sit with an engineer and show them everything theyโ€™ve done, and learn from it."

    Ignasi Vegas

    CEO and Co-founder at Cubbo

  • "Pensero is my compass for knowing where the team is headed.โ€

    Jordi Mirรณ

    CTO at Zynap

  • โ€œFinally a tool that truly increases velocity."

    Nick Traylor

    Head of Engineering at Stord

Sources

Every agent, assistant
and human in one system of record

Every agent, assistant and human in one system of record

Your entire delivery stack, translated into comparable signals. No new workflow, no instrumentation project.

Sources

Every agent, assistant
and human in one system
of record

Your entire delivery stack, translated into comparable signals. No new workflow, no instrumentation project.

Donโ€™t just take our word for it

  • Effortless observability

    โ€œPensero gives me daily peace of mind. I know exactly what the team is working on. The built-in reporting & analytics make team observability effortless, and the leaderboards give us the clarity we need for performance reviews and promotions decisions.โ€

    Jose-Luis Vilar

    Co-Founder and CPTO

  • Live in one day

    โ€œPensero gives me a clear, non-engineerโ€™s view of team productivity. It helps me spot champions who adopt new tools fastest and turn their practices into inspiration for the rest of the team.

    Rather than being a policing tool, it provides a data-driven foundation for bragging rights, better conversations, and benchmarking against peers worldwide. And the best part: it was truly plug-and-play โ€” we were live in just one day.โ€

    Jean-Franรงois Legourd

    Co-founder

  • Conversations backed by evidence

    โ€œPensero offers a modern approach to performance management by providing real-time, actionable insights and continuous improvement. Its features are designed to enhance clarity, accountability, and productivity within teams.

    As a manager that helped me have honest and actionable feedback with my teams enabling them for growth.โ€œ

    Natxo Treig

    Sr. Engineering Manager

  • From 70% to 30% maintenance

    โ€œ15 engineers. $50M a year. We didnโ€™t know exactly how our work was different from where we wanted to go. In one view, we can show engineers everything they didโ€ฆ and they learn a lot of insights.

    Now we went from 70% to 30% maintenanceโ€ฆ itโ€™s where we want it to be. Itโ€™s like the lighthouse of our engineering team.โ€

    Ignasi Vegas

    Co-founder and CEO

  • Top 5% globally, verified

    "I was being told we were slow to ship, but I didn't have any visibility as to why that was. Pensero is story points after the fact โ€” we go 4x faster.

    Engineers love it because they get to brag: they can say they're in the top 5 percent globally, based on an independent third party. Pensero is why you want to work here."

    Andrew Eye

    CEO and Founder

  • Effortless observability

    โ€œPensero gives me daily peace of mind. I know exactly what the team is working on. The built-in reporting & analytics make team observability effortless, and the leaderboards give us the clarity we need for performance reviews and promotions decisions.โ€

    Jose-Luis Vilar

    Co-Founder and CPTO

  • Live in one day

    โ€œPensero gives me a clear, non-engineerโ€™s view of team productivity. It helps me spot champions who adopt new tools fastest and turn their practices into inspiration for the rest of the team.

    Rather than being a policing tool, it provides a data-driven foundation for bragging rights, better conversations, and benchmarking against peers worldwide. And the best part: it was truly plug-and-play โ€” we were live in just one day.โ€

    Jean-Franรงois Legourd

    Co-founder

  • Conversations backed by evidence

    โ€œPensero offers a modern approach to performance management by providing real-time, actionable insights and continuous improvement. Its features are designed to enhance clarity, accountability, and productivity within teams.

    As a manager that helped me have honest and actionable feedback with my teams enabling them for growth.โ€œ

    Natxo Treig

    Sr. Engineering Manager

  • From 70% to 30% maintenance

    โ€œ15 engineers. $50M a year. We didnโ€™t know exactly how our work was different from where we wanted to go. In one view, we can show engineers everything they didโ€ฆ and they learn a lot of insights.

    Now we went from 70% to 30% maintenanceโ€ฆ itโ€™s where we want it to be. Itโ€™s like the lighthouse of our engineering team.โ€

    Ignasi Vegas

    Co-founder and CEO

  • Top 5% globally, verified

    "I was being told we were slow to ship, but I didn't have any visibility as to why that was. Pensero is story points after the fact โ€” we go 4x faster.

    Engineers love it because they get to brag: they can say they're in the top 5 percent globally, based on an independent third party. Pensero is why you want to work here."

    Andrew Eye

    CEO and Founder

Donโ€™t just take our word for it

  • Effortless observability

    โ€œPensero gives me daily peace of mind. I know exactly what the team is working on. The built-in reporting & analytics make team observability effortless, and the leaderboards give us the clarity we need for performance reviews and promotions decisions.โ€

    Jose-Luis Vilar

    Co-Founder and CPTO

  • Live in one day

    โ€œPensero gives me a clear, non-engineerโ€™s view of team productivity. It helps me spot champions who adopt new tools fastest and turn their practices into inspiration for the rest of the team.

    Rather than being a policing tool, it provides a data-driven foundation for bragging rights, better conversations, and benchmarking against peers worldwide. And the best part: it was truly plug-and-play โ€” we were live in just one day.โ€

    Jean-Franรงois Legourd

    Co-founder

  • Conversations backed by evidence

    โ€œPensero offers a modern approach to performance management by providing real-time, actionable insights and continuous improvement. Its features are designed to enhance clarity, accountability, and productivity within teams.

    As a manager that helped me have honest and actionable feedback with my teams enabling them for growth.โ€œ

    Natxo Treig

    Sr. Engineering Manager

  • From 70% to 30% maintenance

    โ€œ15 engineers. $50M a year. We didnโ€™t know exactly how our work was different from where we wanted to go. In one view, we can show engineers everything they didโ€ฆ and they learn a lot of insights.

    Now we went from 70% to 30% maintenanceโ€ฆ itโ€™s where we want it to be. Itโ€™s like the lighthouse of our engineering team.โ€

    Ignasi Vegas

    Co-founder and CEO

  • Top 5% globally, verified

    "I was being told we were slow to ship, but I didn't have any visibility as to why that was. Pensero is story points after the fact โ€” we go 4x faster.

    Engineers love it because they get to brag: they can say they're in the top 5 percent globally, based on an independent third party. Pensero is why you want to work here."

    Andrew Eye

    CEO and Founder

How it works

Get started in minutes.
See insights in hours.

Get started in minutes.
See insights in hours.

Connect your stack. See months of history from day one.

How it works

Get started in minutes.
See insights in hours.

Connect your stack. See months of history from day one.

1 hour

Connect & Structure

Repositories, tickets, chat and AI tools connect automatically. Every unit of work, human, AI-assisted or agent, is structured and scored on the same scale.

1 hour

Connect & Structure

Repositories, tickets, chat and AI tools connect automatically. Every unit of work, human, AI-assisted or agent, is structured and scored on the same scale.

1 day

Analyse & Attribute

Output separated by source: human, AI-assisted, agent-only. Cost per unit of delivered work, rework attribution, and where agents are creating bottlenecks upstream.

1 day

Analyse & Attribute

Output separated by source: human, AI-assisted, agent-only. Cost per unit of delivered work, rework attribution, and where agents are creating bottlenecks upstream.

1 week

Calibrate & Decide

Head-to-head agent comparison against benchmark. Which agents stay, where the next one goes, and what to keep human with board-ready numbers behind each answer.

1 week

Calibrate & Decide

Head-to-head agent comparison against benchmark. Which agents stay, where the next one goes, and what to keep human with board-ready numbers behind each answer.

Pricing

We fit your needs

We fit your needs

Simple plans. Scale as your team grows.

Pricing

We fit your needs

Simple plans. Scale as your team grows.

Starter

Free

Everything you need to start.

Up to 5 users

1 code repository

Delivery metrics

Quality metrics

Collaboration metrics

AI Impact tracking

Engineering investment tracking

Team and individual reports

90-day data retention

Starter

Free

Everything you need to start.

Up to 5 users

1 code repository

Delivery metrics

Quality metrics

Collaboration metrics

AI Impact tracking

Engineering investment tracking

Team and individual reports

90-day data retention

Growth

$50

/ seat / month

For teams at scale.

Everything in Starter

Unlimited users

Unlimited code repositories

SSO / SAML and directory sync

API/MCP access

1-year data retention

MOST POPULAR

Growth

$50

/ seat / month

For teams at scale.

Everything in Starter

Unlimited users

Unlimited code repositories

SSO / SAML and directory sync

API/MCP access

1-year data retention

MOST POPULAR

Enterprise

Usage Based Pricing

Get R&D capitalization and on-prem.

Everything in Growth

R&D capitalization

On-prem and custom integrations

Devin integration included

Dedicated CSM and priority support

Custom onboarding and training

API access

MCP capabilities

Enterprise

Usage Based Pricing

Get R&D capitalization and on-prem.

Everything in Growth

R&D capitalization

On-prem and custom integrations

Devin integration included

Dedicated CSM and priority support

Custom onboarding and training

API access

MCP capabilities

See what your agents
are actually delivering

See what your agents
are actually delivering

Connect one repository and get months of history back. No instrumentation, no workflow change. Your own data, in minutes.

See what your agents
are actually delivering

Connect one repository and get months of history back. No instrumentation, no workflow change. Your own data, in minutes.