DevOps Maturity Model Roadmap | Pensero
Learn how the DevOps maturity model helps teams move from chaos to continuous operations with structured stages and measurable improvements.

The DevOps Maturity Model provides a structured framework for assessing your organization's DevOps sophistication and creating a clear improvement roadmap. It's not just theory, it's a practical tool that guides teams from chaotic, manual processes to fully integrated, automated operations.
The impact is measurable. The Business Development Bank of Canada used this framework to achieve 51% faster delivery, 74% reduction in pre-development time, and $700,000 in annual productivity gains within three months.
This guide explains the five maturity levels, key metrics for measuring progress, and how to conduct effective assessments that drive real improvement.
The Five Levels of DevOps Maturity
Each level represents a significant step in your DevOps journey, building on the previous stage to create increasingly efficient, automated workflows.
Level 1: Initial (Ad Hoc)
What it looks like:
Traditional siloed teams working independently. Development throws code over the wall to operations. Minimal to no automation. Deployments are manual, infrequent, and error-prone.
Key characteristics:
Manual deployment processes
Separate dev and ops teams with poor communication
No standardized practices
Deployments take days or weeks
High failure rates
Firefighting is the norm
Primary challenge:
Lack of communication and automation increases security breach risk and slows the entire development process.
Focus for improvement:
Break down silos and introduce basic collaboration. Start with simple automation for the most painful manual tasks.
Typical organizations at this level:
Traditional enterprises with legacy processes
Small teams without dedicated ops
Organizations new to software delivery
Level 2: Managed (Repeatable)
What it looks like:
Basic DevOps practices and tools are introduced. Some automation exists, particularly for Continuous Integration. Cross-functional teams begin forming.
Key characteristics:
CI pipelines automate builds and tests
Version control is standard
Basic monitoring in place
Some infrastructure as code
Regular team collaboration
Deployments weekly or bi-weekly
Primary challenge:
Ensuring alignment across different teams while managing the transition away from traditional manual methods.
Focus for improvement:
Implement configuration management. Automate repetitive tasks. Standardize processes across teams.
Indicators you've reached this level:
Builds run automatically on commit
Tests execute in CI pipeline
Code reviews are standard practice
Deployment process is documented
Level 3: Defined (Continuous Delivery)
What it looks like:
Organization-wide adoption of standardized DevOps processes. Automation is widespread across the SDLC. Continuous Delivery becomes the standard.
Key characteristics:
Automated deployment pipelines to staging
Comprehensive test automation
Infrastructure fully as code
Standardized workflows across teams
Security integrated into pipeline
Deployments daily or multiple times per day
One-click production deployment (manual approval)
Primary challenge:
Moving from team-level adoption to consistent, organization-wide standards for all development and operations.
Focus for improvement:
Establish robust continuous deployment pipelines. Improve software quality through comprehensive testing. Reduce deployment risk through automation.
Indicators you've reached this level:
Code can deploy to production at any time
Rollback is automated and reliable
Feature flags control releases
Environment parity is high
Level 4: Measured (Continuous Deployment)
What it looks like:
Performance is actively monitored using key metrics. Continuous Deployment is implemented with automated production deployments. Data-driven insights guide optimization.
Key characteristics:
DORA metrics tracked and improving
Automated deployments to production
Comprehensive monitoring and observability
Incident response is data-driven
Deployment frequency: multiple times per day
Lead time: hours, not days
Change failure rate: <15%
MTTR: less than one hour
Primary challenge:
Ensuring teams consistently collect and act upon data to optimize workflows, rather than just collecting metrics for their own sake.
Focus for improvement:
Use metrics and KPIs to drive continuous improvement. Identify and eliminate bottlenecks systematically. Optimize the entire delivery process.
Indicators you've reached this level:
Metrics inform all major decisions
Bottlenecks identified and addressed quickly
Team discusses metrics in retrospectives
Improvement trends are visible
Level 5: Optimized (Continuous Operations)
What it looks like:
DevOps is fully integrated into organizational culture, it's the default way of working. Extensive self-service automation exists. Highly cross-functional teams experiment and innovate freely.
Key characteristics:
DevOps is cultural, not just technical
Self-service platforms for developers
Autonomous teams with full ownership
Continuous experimentation and learning
Proactive optimization before problems arise
Industry-leading metrics
Innovation is systematic, not random
Primary challenge:
Maintaining momentum of continuous improvement and avoiding complacency as the organization grows and scales.
Focus for improvement:
Nurture culture of continuous innovation. Scale practices to new teams and products. Share learnings across the organization.
Indicators you've reached this level:
New engineers productive within days
Teams deploy confidently without fear
Experiments run constantly
Knowledge sharing is systematic
Measuring DevOps Maturity: The DORA Metrics
The DevOps Research and Assessment (DORA) metrics provide the industry standard for measuring software delivery performance. These four metrics reveal your true maturity level.
1. Deployment Frequency
What it measures: How often you successfully release to production
Performance levels:
Elite: On-demand (multiple deploys per day)
High: Between once per day and once per week
Medium: Between once per week and once per month
Low: Fewer than once per month
2. Lead Time for Changes
What it measures: Time from commit to production deployment
Performance levels:
Elite: Less than one hour
High: Between one day and one week
Medium: Between one week and one month
Low: More than one month
3. Change Failure Rate
What it measures: Percentage of deployments causing production failure
Performance levels:
Elite: 0-15%
High: 16-30%
Medium: 31-45%
Low: 46-60%
4. Time to Restore Service (MTTR)
What it measures: Time to recover from production failure
Performance levels:
Elite: Less than one hour
High: Less than one day
Medium: Between one day and one week
Low: More than one week
Using DORA Metrics Effectively
Track trends, not snapshots: One month's metrics don't tell the full story. Monitor improvement over quarters and years.
Balance all four metrics: Optimizing deployment frequency while ignoring change failure rate creates problems. Elite performers excel across all dimensions.
Context matters: A team migrating to microservices may see temporary metric degradation. Understand why metrics change.
Use metrics to identify bottlenecks: If lead time is high but deployment frequency is good, focus on streamlining your pipeline. If change failure rate is high, invest in testing.
Conducting Your DevOps Maturity Assessment
A structured assessment reveals where you are and guides where to focus improvement efforts.
Step 1: Define Goals and Scope
Clarify objectives:
Increase deployment speed?
Improve system stability?
Reduce operational costs?
Determine scope:
Entire organization?
Specific business unit?
Pilot team?
Single product line?
Step 2: Gather Quantitative Data
Collect DORA metrics from:
CI/CD tools (Jenkins, GitLab CI, GitHub Actions)
Monitoring platforms (Datadog, New Relic, PagerDuty)
Version control systems (GitHub, GitLab, Bitbucket)
Project management tools (Jira, Linear)
Automate collection where possible:
Most modern platforms can export metrics automatically. Manual tracking is error-prone and time-consuming.
Step 3: Gather Qualitative Data
Conduct stakeholder interviews:
Developers: Pain points in daily work?
Operations: Biggest operational challenges?
Management: Business impact of delays?
Product: Ability to respond to market needs?
Run team surveys:
How confident are you in deployments?
How much time do you spend on toil vs. innovation?
How effective is collaboration between teams?
What's the biggest blocker to shipping faster?
Step 4: Analyze and Identify Gaps
Compare current state to maturity model:
Map your practices to the five levels. Most organizations have different maturity across different areas:
CI/CD: Level 3
Monitoring: Level 2
Culture: Level 4
Automation: Level 2
Identify bottlenecks:
Where do delays happen most frequently?
Which manual processes create the most pain?
What causes deployment anxiety?
Where do teams lack autonomy?
Step 5: Create Improvement Roadmap
Prioritize based on:
Business impact (which improvements deliver most value?)
Difficulty (quick wins vs. long-term investments)
Dependencies (what must happen first?)
Team capacity (what can you realistically tackle?)
Set measurable goals:
Improve deployment frequency from weekly to daily
Reduce lead time from 3 days to 8 hours
Decrease change failure rate from 25% to 15%
Cut MTTR from 4 hours to 1 hour
Implement incrementally:
Don't try to jump from Level 1 to Level 5 overnight. Progress one level at a time, building capabilities systematically.
Tracking Progress with Engineering Intelligence
Moving up the maturity model requires visibility into whether improvements actually work. Traditional metrics tools show the numbers, but modern engineering intelligence platforms help you understand what they mean.
How Pensero Helps
Clear visibility into maturity progress:
Pensero's Executive Summaries translate DevOps improvements into language everyone understands:
"Deployment frequency increased 40% this quarter as the team automated staging deployments. Lead time decreased from 2 days to 6 hours. The team is now operating at DORA High Performer level."
Understanding work patterns, not just metrics:
Body of Work Analysis reveals whether teams are actually building capabilities or just going through motions. Are deployments more frequent because teams ship real features, or because they've gamed the metrics?
Daily improvement tracking:
"What Happened Yesterday" shows whether automation initiatives are reducing manual toil or creating new overhead. See immediately when improvements deliver value or create friction.
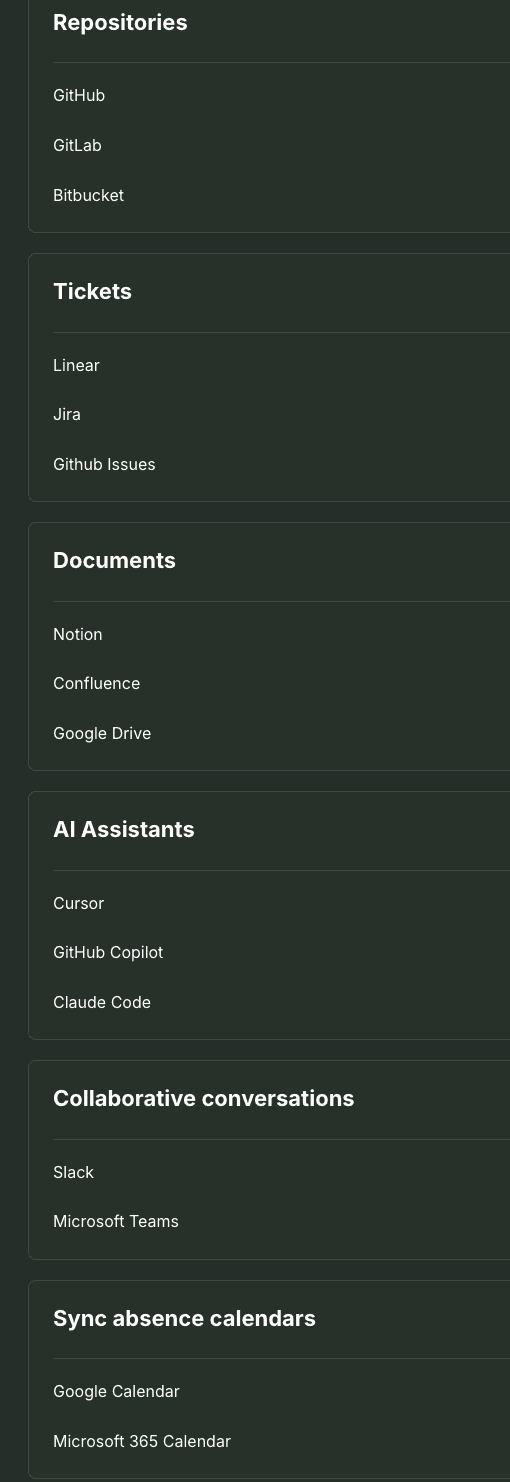
Simple Integration, Clear Insights
Integrations: Notion, Drive, Calendar, Slack, GitHub, Claude, Microsoft Teams, YT, Jira, Linear, GitLab, GitHub Copilot.
Pricing: Free for up to 10 engineers; $50/month premium; custom enterprise
Security: SOC 2 Type II, HIPAA, GDPR compliant
Customers: TravelPerk, Elfie.co, Caravelo
Pensero helps teams focus on outcomes (faster, more reliable delivery) rather than getting lost in metric collection. You see whether your maturity improvements actually make engineering more effective.
Culture: The Hidden Dimension of DevOps Maturity
Technical practices are necessary but not sufficient. True DevOps maturity requires cultural transformation.
Key Cultural Indicators by Level
Level 1-2: Blame culture, silos, fear of deployment, heroic firefighting
Level 3: Collaboration forming, shared responsibility emerging, still some finger-pointing
Level 4: Blameless postmortems, psychological safety, learning from failures
Level 5: Innovation expected, autonomy respected, continuous learning systematic
Building DevOps Culture
Shift from blame to learning: Focus postmortems on system failures, not individual mistakes.
Create psychological safety: Teams must feel safe to experiment, fail, and speak up about problems.
Encourage cross-functional collaboration: Rotate developers through on-call. Include ops in planning. Create shared goals.
Celebrate learning, not just shipping: Recognize teams that run valuable experiments, even when they fail.
DevSecOps: Security Integration Across Maturity Levels
As organizations mature, security naturally integrates into every SDLC stage, a practice called DevSecOps.
Security by Maturity Level
Level 1-2: Security is a gate before production, often blocking deployments at the last minute
Level 3: Security tools integrated into CI/CD pipeline with automated scanning
Level 4: Security metrics tracked alongside delivery metrics, continuous improvement
Level 5: Security is everyone's job, "shift-left" is complete, security enables velocity
Implementing Shift-Left Security
Automate security scanning: Integrate SAST, DAST, dependency scanning into pipelines
Make security visible: Include security metrics in dashboards alongside DORA metrics
Train developers: Security isn't ops' job alone; everyone needs basic security knowledge
Fast feedback loops: Developers should see security issues within minutes, not days
Common Pitfalls in DevOps Maturity Journeys
Organizations often make similar mistakes when advancing through maturity levels.
Pitfall 1: Skipping Levels
The mistake: Trying to jump from Level 1 to Level 4 without building foundational capabilities
Why it fails: Level 4 requires automation and testing from Level 3, which requires basic CI/CD from Level 2
The solution: Progress sequentially, building each capability before moving forward
Pitfall 2: Focusing Only on Tools
The mistake: Buying CI/CD tools without changing culture or processes
Why it fails: Tools enable DevOps but don't create it; cultural change is equally important
The solution: Balance tooling investments with culture and process improvements
Pitfall 3: Metrics Without Action
The mistake: Collecting DORA metrics but never using them to drive improvement
Why it fails: Metrics are diagnostic tools, not goals themselves
The solution: Review metrics regularly, identify bottlenecks, implement improvements, measure impact
Pitfall 4: One-Size-Fits-All Approach
The mistake: Forcing all teams to adopt identical practices regardless of context
Why it fails: Different teams, products, and constraints require different approaches
The solution: Define principles, not prescriptions; allow teams to adapt within guardrails
The Bottom Line
The DevOps Maturity Model provides a structured path from chaotic, manual operations to optimized, continuous delivery. Organizations progress through five levels: Initial, Managed, Defined, Measured, and Optimized.
Success requires balancing technical practices with cultural transformation. DORA metrics, deployment frequency, lead time for changes, change failure rate, and MTTR, provide objective measures of progress.
Effective maturity assessments combine quantitative metrics with qualitative understanding of team culture and collaboration. Improvements work best when implemented incrementally, building capabilities level by level rather than attempting dramatic leaps.
For engineering leaders, the framework helps identify current capabilities, prioritize improvements, and track progress over time. The goal isn't reaching Level 5 for its own sake, it's delivering software faster and more reliably to create business value.
Platforms like Pensero help teams see whether their maturity improvements actually deliver results, translating metrics into insights that inform strategy and demonstrate engineering effectiveness to stakeholders.
