Internal reality is what drives your decisions.
Pensero lets you compare any team, cohort, or individual side by side on real delivery, quality, and AI impact.
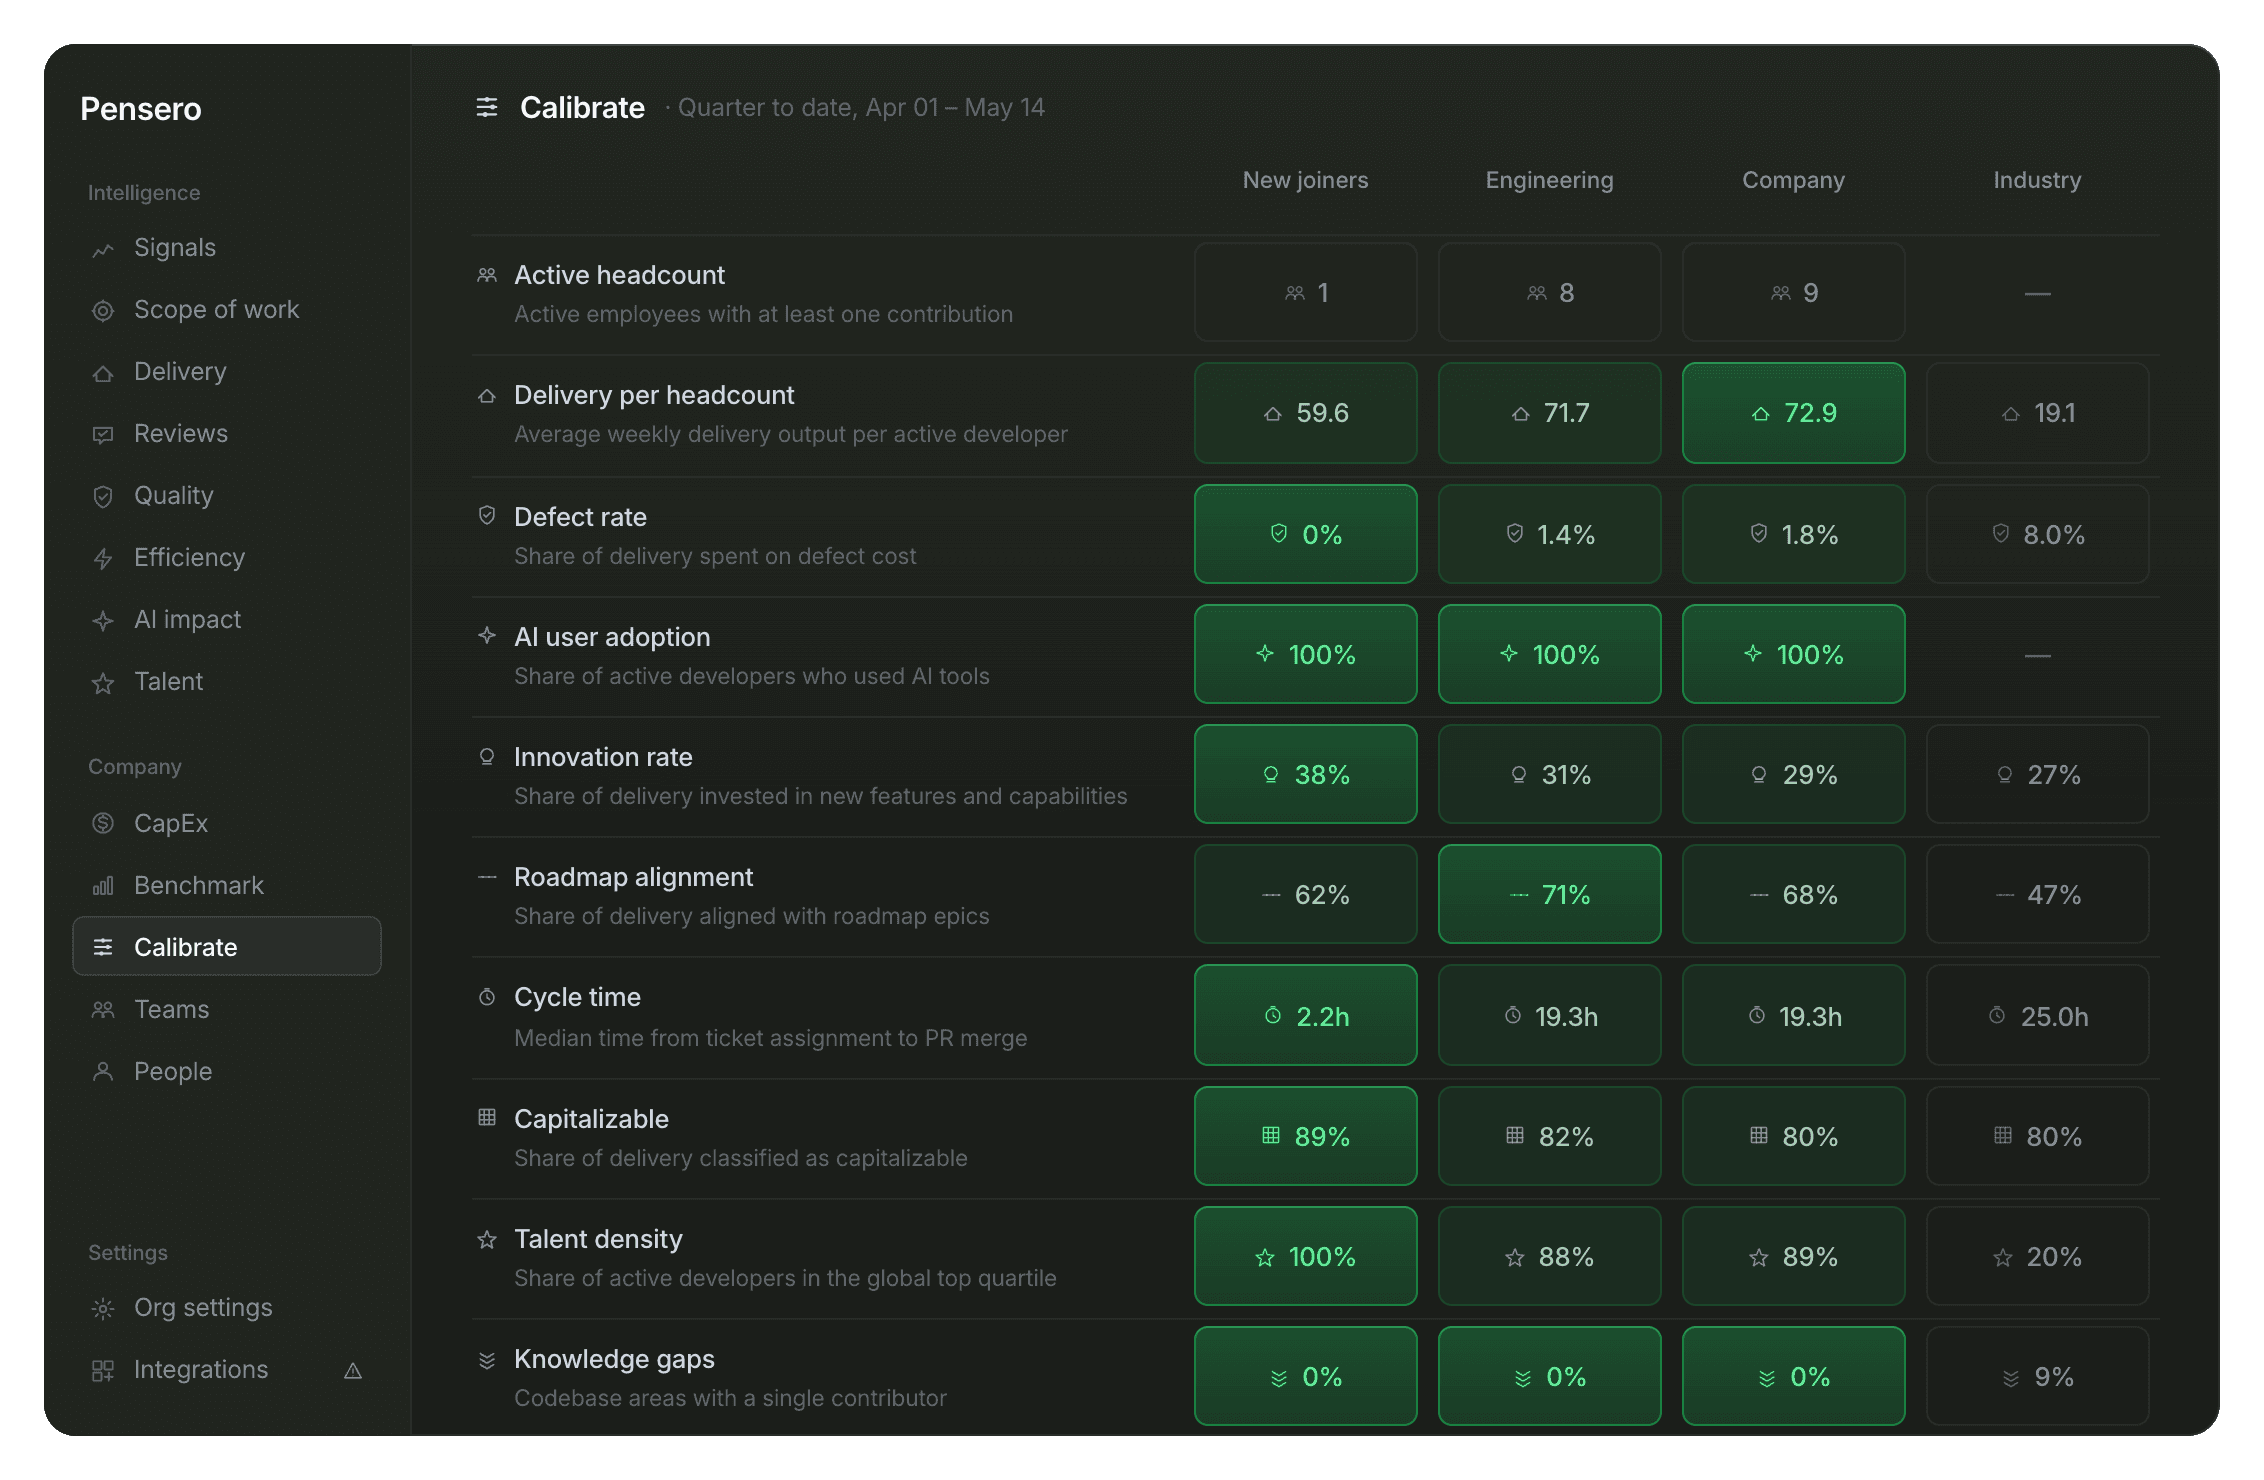


Industry benchmark comparison
See how your engineering organization compares against industry peers across delivery, quality, collaboration, and AI impact. Understand whether your teams are truly outperforming or simply keeping pace.
Product asset highlights
Industry percentile rankings
Delivery and quality benchmarks
AI adoption and impact comparison

Team calibration & scoring
Put Backend, Frontend, Platform, AI, or Infrastructure teams side by side using the same measurement framework. Quickly identify differences in execution, quality, collaboration, and innovation patterns.
Product asset highlights
Cross-team comparison
Delivery vs quality analysis
Collaboration and AI adoption patterns
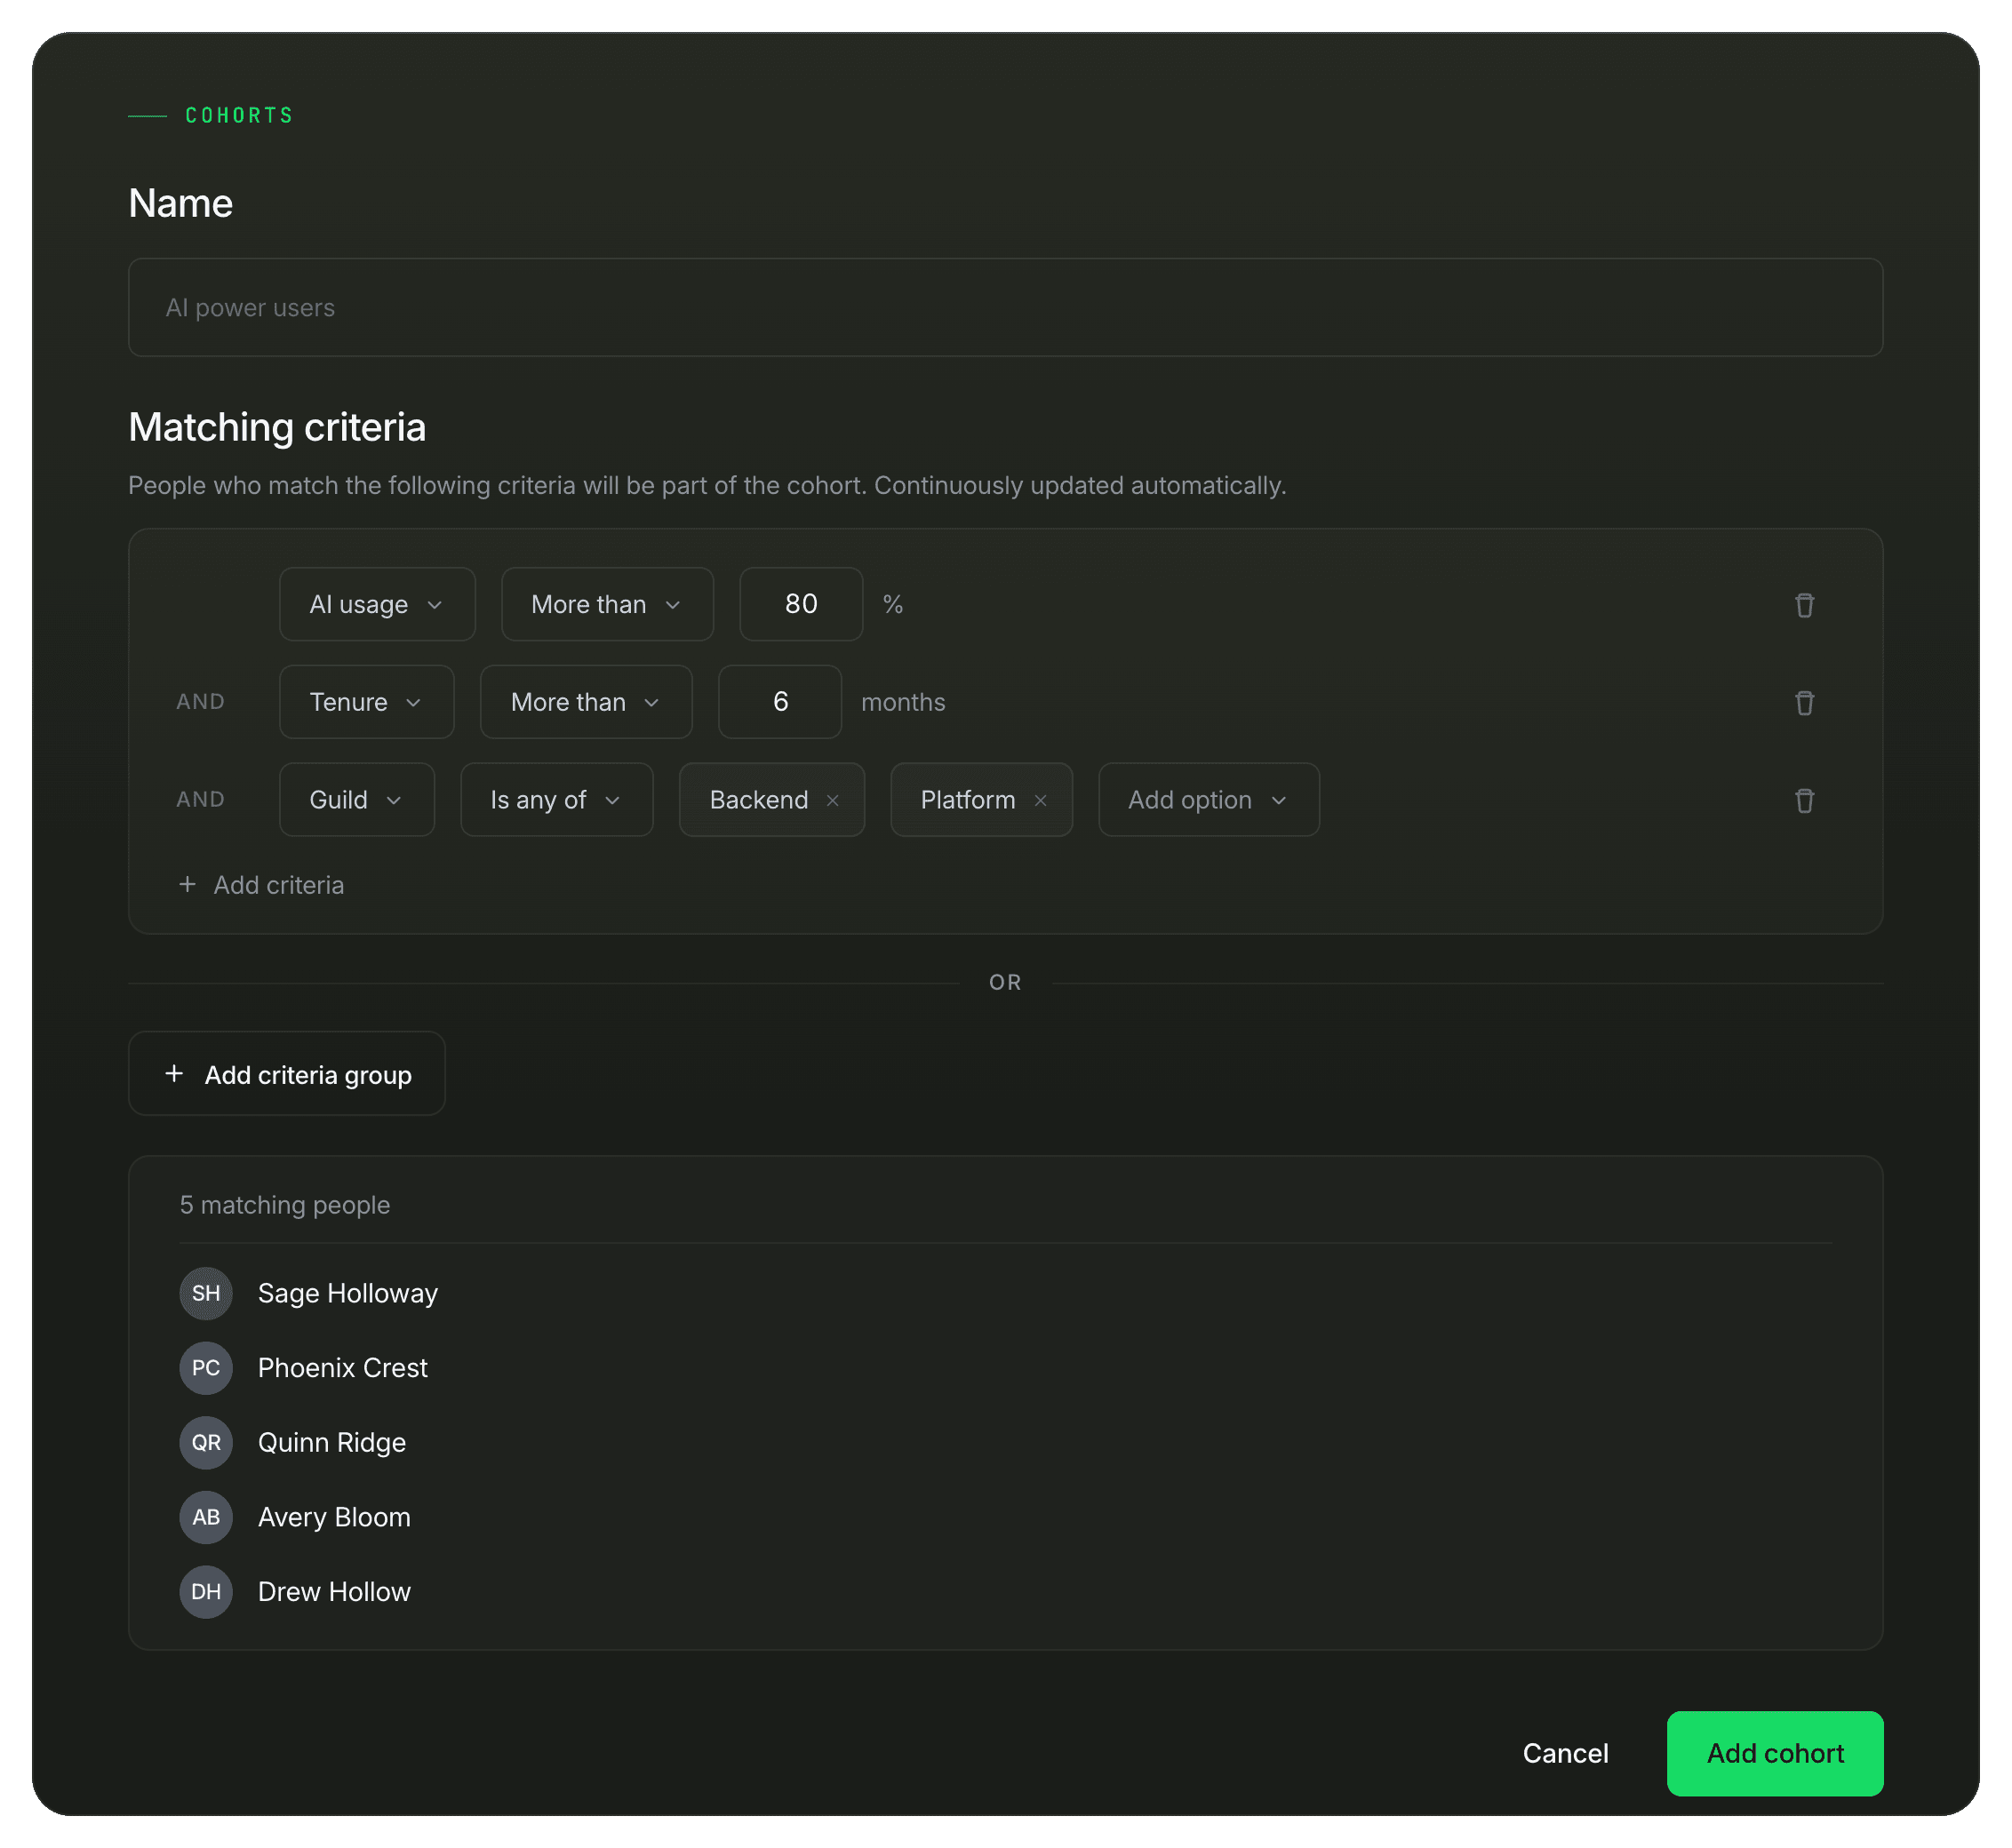
cohort comparison analysis
Compare groups based on role, level, tenure, location, vendor, or AI adoption. Surface patterns that traditional org structures and reporting lines fail to reveal.
Product asset highlights
Dynamic cohort creation
AI adopters vs non-adopters
Organizational pattern analysis
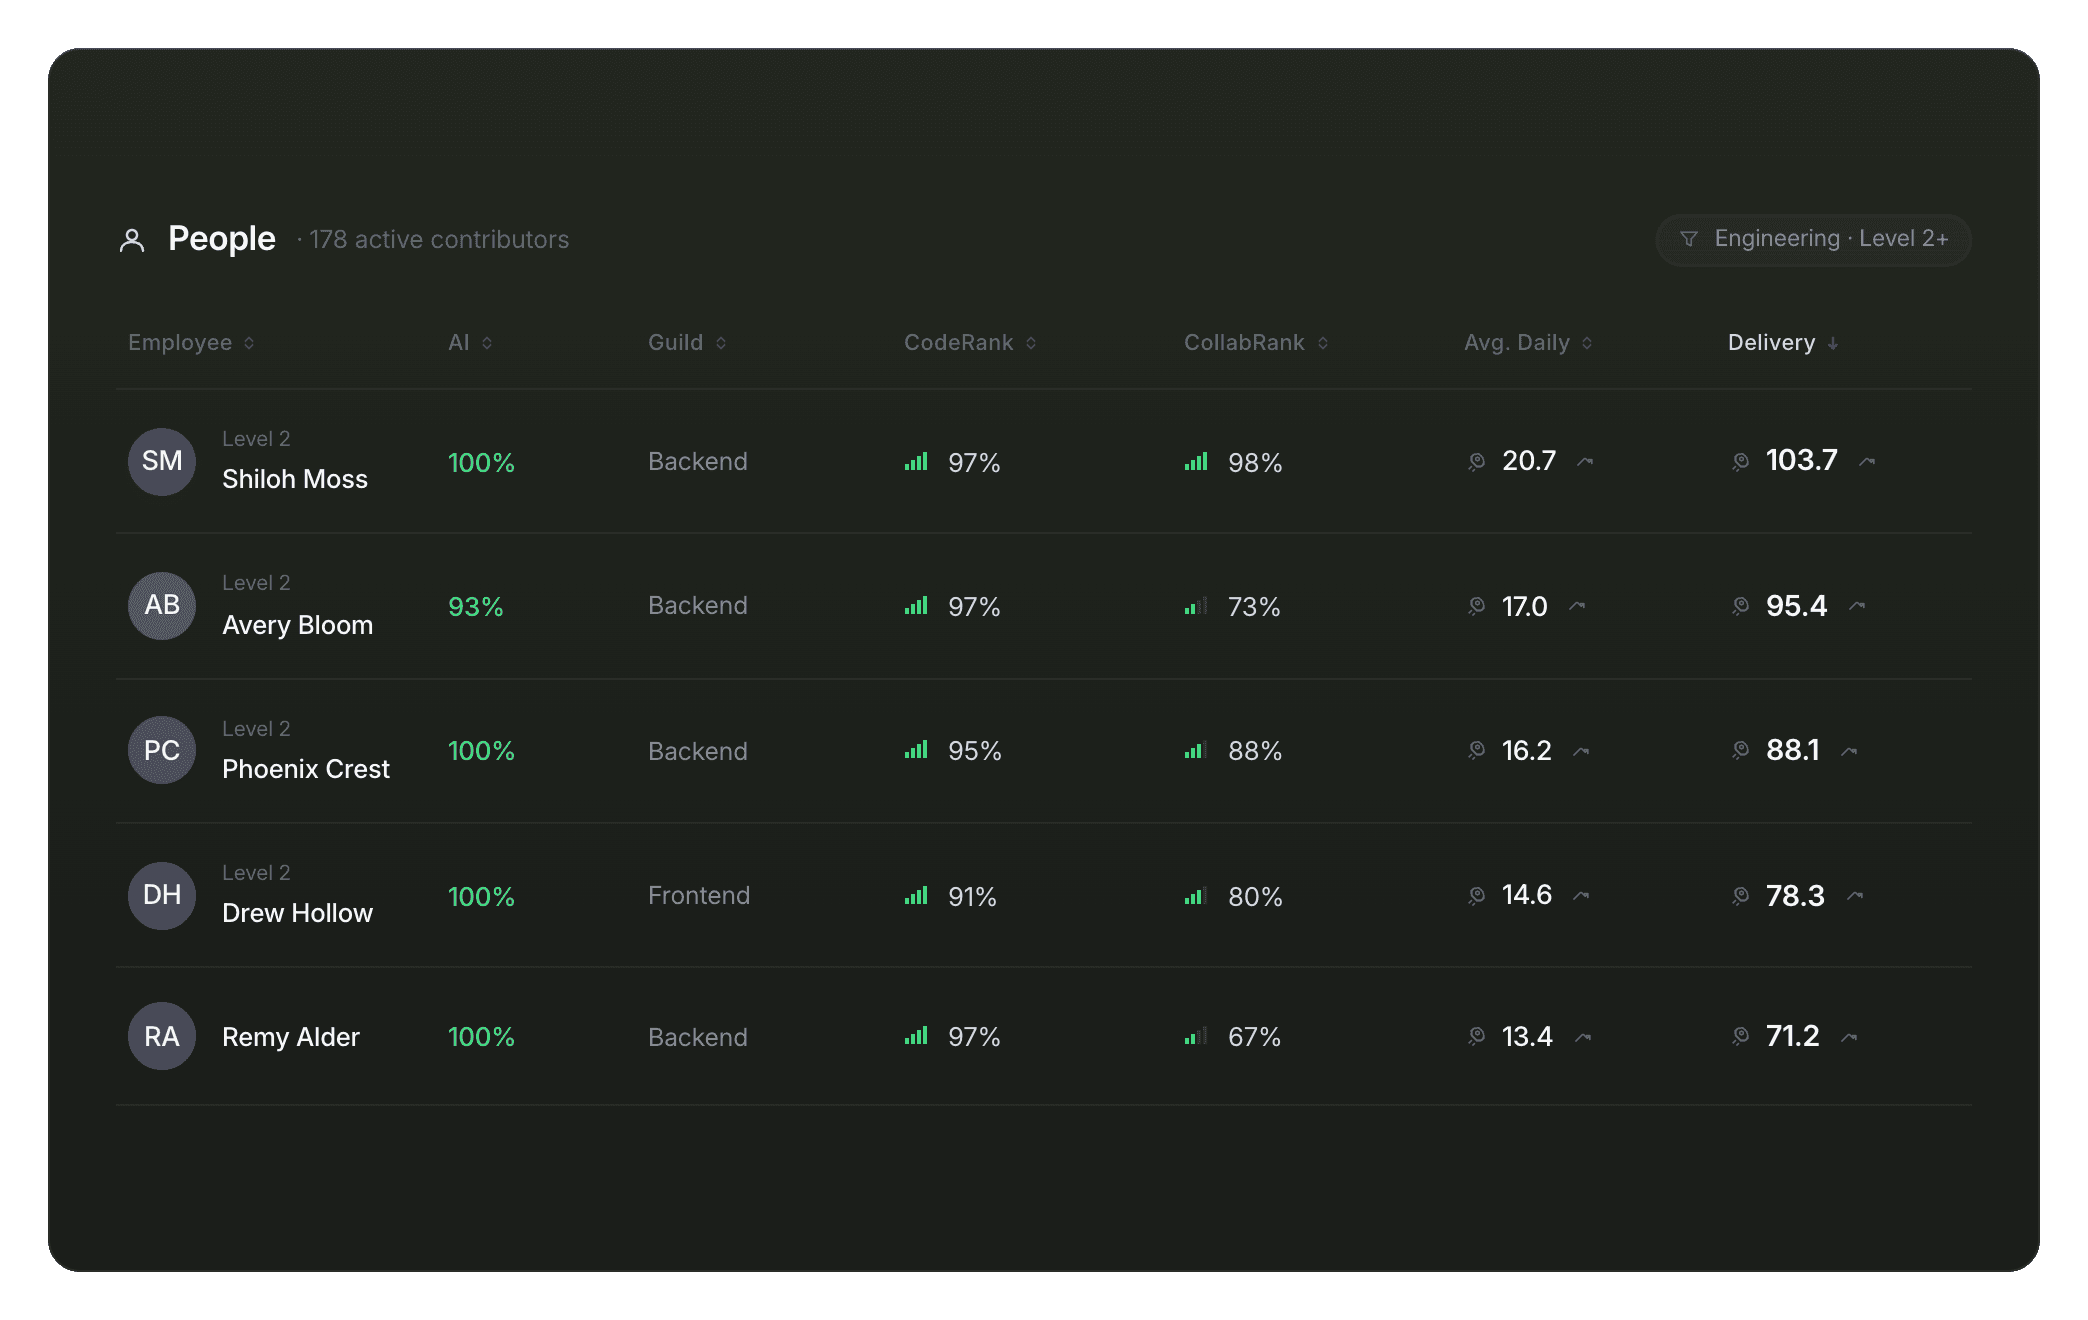
Performance measurement
Add objective operational context into calibration, promotion, onboarding, and organizational planning decisions. Reduce reliance on anecdotes, recency bias, and visibility politics.
Product asset highlights
Individual vs peer comparison
Performance trend visibility
Collaboration and knowledge-sharing signals
COLOR-CODED SCORING
(ABOVE/BELOW COMPANY & INDUSTRY)
Built for decisions.
Up to 10 groups side by side
11 performance metrics
Drill-down into every metric
FAQ
Questions
teams ask
Can I compare more than just teams?
How is this different from standard engineering metrics tools?
How do you account for teams working on different complexity levels?
Can I measure the impact of AI adoption?
Where does the industry benchmark come from?
