Bonus: Are We Getting Better? — Productivity and Leverage over Time
Mini-Series: Reporting to the Board — What Every Tech Executive Should Measure (and Why)


Introduction
Over the past few weeks, we’ve explored the four key questions every tech executive should be able to answer with confidence:
Do we have the right team? — Understanding your talent density and capability health.
Are we getting the best from them? — Measuring leverage, productivity, and developer experience.
Are we working on the right things? — Ensuring alignment between engineering effort and business priorities.
Are we reliable? — Building trust through product quality, stability, and operational maturity.
Now comes the final, often overlooked question, the one that gives meaning to all the others:
Are we getting better over time?
Because it doesn’t matter how good your numbers look in isolation. What matters is your trajectory, your organization’s ability to learn, adapt, and improve.
Why this question matters
Every organization operates under different circumstances. Constraints, maturity levels, or risks differ from one to another. So in practice, you’re not competing with other companies. You’re competing with your past self.
Baselines help — they give perspective. But what really matters is:
Where we are today
Where we want to be
Whether the curve to get there is moving in the right direction
This is also why one-off metrics can be misleading.
A team can look great this month because they pushed hard, delayed maintenance, or got lucky with the type of work they had. That doesn’t mean the system improved, and as an executive, you need something more honest:
progress with intent — improvement you can explain, repeat, and sustain.
Why “maturity” frameworks are not enough
As engineering leaders, we’ve spent years embracing — and often pioneering — the adoption of DORA, SPACE, and traditional SDLC frameworks. They made our industry better: they brought discipline and a shared language.
But as long-term practitioners, we’ve also seen the limits, especially in conversations with founders, CFOs, or at board-level.
DORA is a maturity model. It’s excellent for building foundational delivery habits. But once teams reach “Elite,” the signal can flatten. You can be “Elite” and still have bottlenecks, slow learning loops, or misalignment that DORA won’t surface.
SPACE is a strong framework, but it’s sensitive to bias since it’s perception-based. Two teams can have “the same score” even if one ships manually once a month and the other runs continuous deployment, because perception depends on what people have experienced. (And they can be both in the same company, as a consequence of a typical M&A scenario)
SDLC metrics can drift into vanity. Easy to report. Hard to tie to business outcomes.
All three matter. They help build the picture. But they share one weakness:
They don’t speak the language of the business.
In a board meeting, “We’re Elite in DORA” rarely answers what leaders actually want to know:
Are we increasing value per engineering $?
Are we reducing risk?
Are we learning faster?
Are we improving our ability to execute the strategy?
That’s why trends matter.
What “getting better” actually means
You don’t need a dashboard with 40 charts. You need a small set of trend lines you can review consistently with a narrative that clearly explains what changed and why.
Here are the trend signals I’ve found most useful when reporting at exec level.
1) Leverage trend: effort into impact
This is all about return on engineering investment.
Are we converting engineering time into customer value more effectively?
Are we wasting less energy in handoffs, waiting time, interruptions, and rework?
Are we protecting focus so teams can actually finish meaningful work?
2) Productivity trend: not as a weapon, as a mirror
Productivity is not about individual performance. It’s about system stability
Is meaningful throughput stable (not ticket count, not story points)?
Are we building a repeatable pace, or relying on hero weeks?
Do we see dips after org changes, onboarding waves, or product churn — and can we explain them?
3) Rework and quality trend — the hidden tax
Rework compounds quietly.
Is bug fixing and rework going up or down?
Are incidents repeating, or getting eliminated?
Are we moving fast and improving the system — or moving fast by accumulating debt?
4) Learning-speed trend — closing loops faster
Learning speed showcases adaptability and ability to respond.
How quickly do we ship, get feedback, and adjust?
Are we catching problems earlier (before customers do)?
Are we reducing “late surprises” that explode plans near the end?
The goal is not to prove you’re perfect. The goal is to be able to answer, consistently:
What is moving? What is stuck? What did we do about it? What will we do next?
That’s what credibility looks like at executive level.
At Pensero
At Pensero, we surface these key metrics as weekly and annual trends, so you can visualize how your teams evolve over time across the dimensions that matter most: talent, productivity, focus, reliability, and strategic alignment.
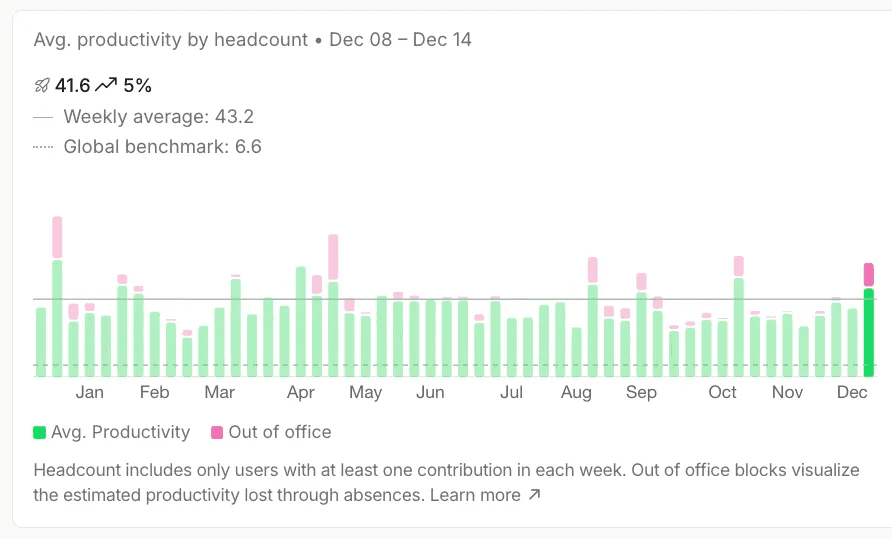
Average Productivity with global benchmark baseline
This longitudinal view matters because as an executive, your job isn’t to present perfection — it’s to show progress with intent.
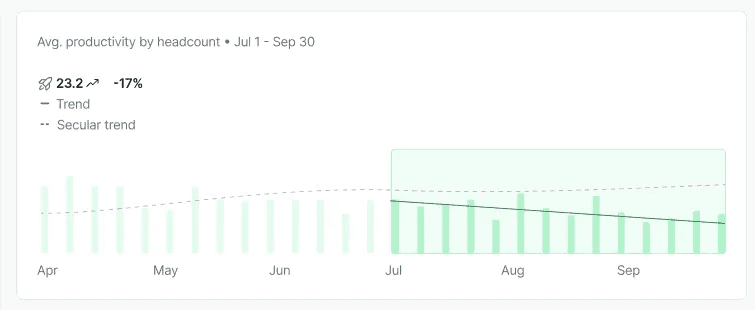
Average Productiviy with Secular trend
Sometimes that means showing your peers or board not where you were supposed to be, but where you actually are, and how your actions are turning the curve in the right direction.
Improvement isn’t about proving success. It’s about building credibility through transparency — and turning data into momentum.
Closing Note
Boards don’t back frameworks. They back leaders.
In a boardroom, confidence is the shared belief that this team knows where it’s going, understands the risks, and is deliberately shaping the right outcome.
That confidence isn’t built with labels like “Elite in DORA”. It’s built with a clear trajectory — and the decisions that move it.
If you’ve ever tried to understand your team through data — and felt the frustration of doing it with spreadsheets, or with tools that only rely on ticket lifecycles or member surveys, without getting a holistic and factual view — stay tuned. We’re building something for you.
And if you want to join a blue-ocean opportunity — and help shape how engineering teams navigate this new technology age — check out our careers page.
