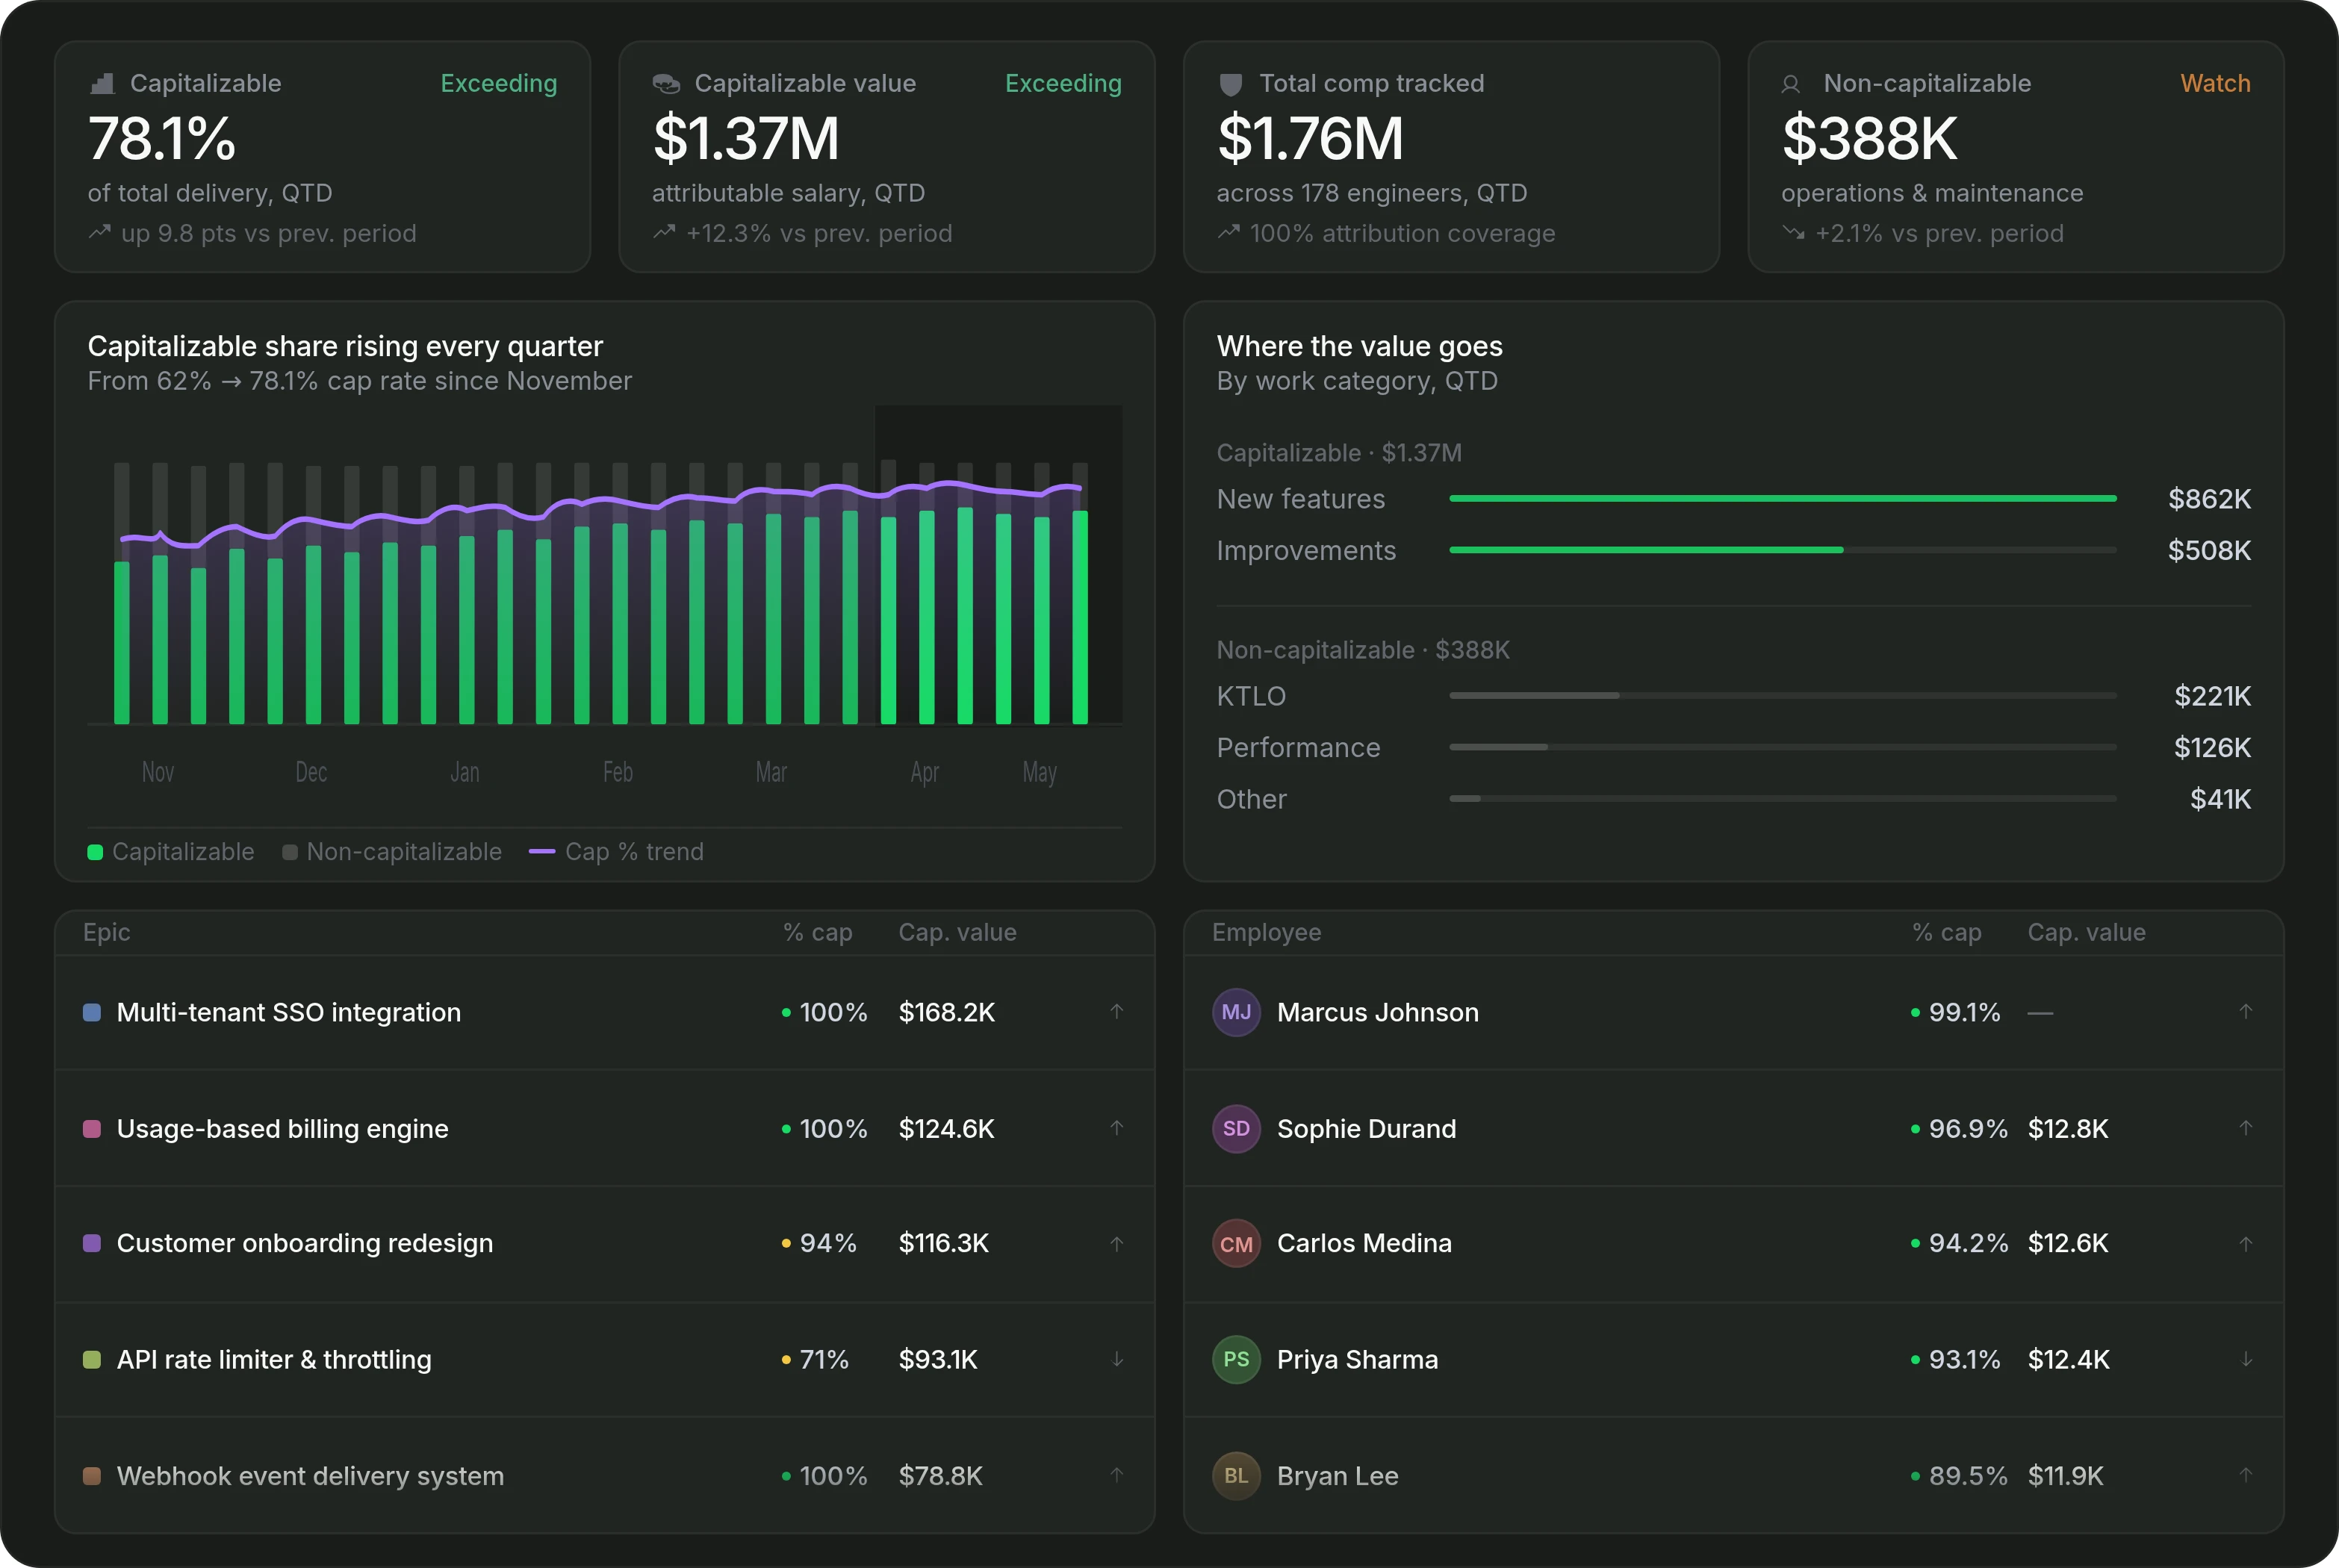
Capex
A CFO asked to approve next year's AI budget will ask what this year's produced. Usage statistics are not an answer. Pensero connects tool, model, agent and review costs to units of delivered work, and turns delivery activity into audit-ready CapEx and R&D reporting.





Engineering CapEx reporting
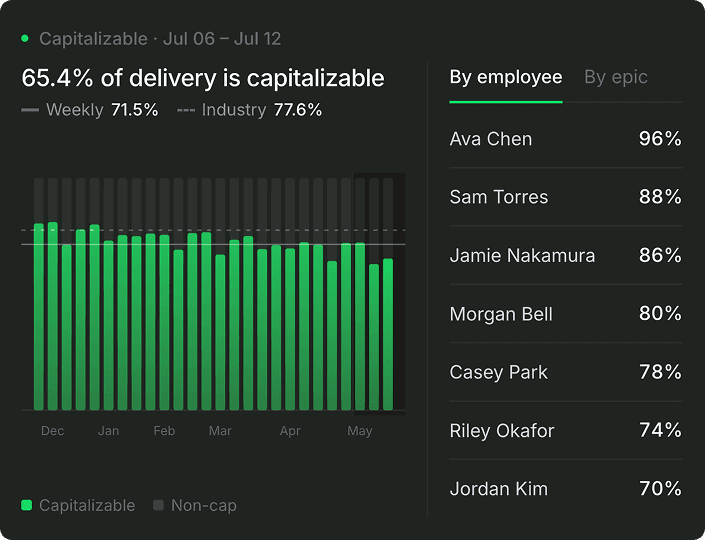
Capitalize work, automatically
Replace manual tagging and spreadsheets with continuous, evidence-based classification of capitalizable versus expensed work, whether it was delivered by an engineer, an assistant or an agent.
Capitalized vs expensed work tracking
Project-level visibility
Human and agent work classification
R&D capitalization compliance
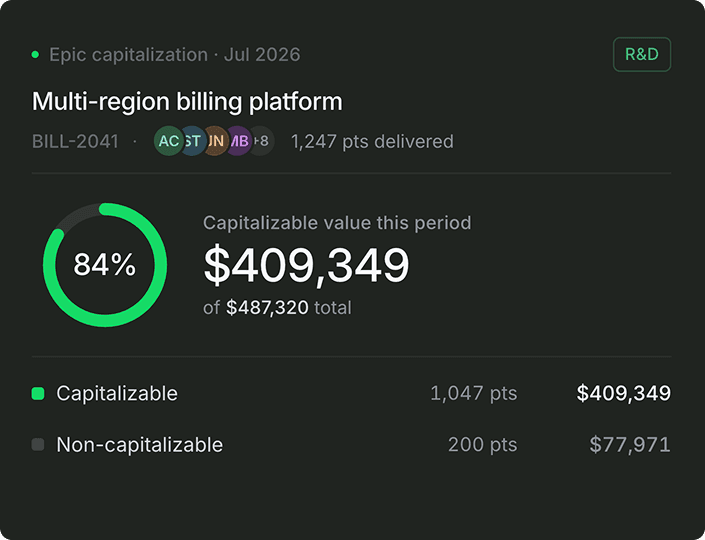
Audit-ready, out of the box
Generate finance-ready reports backed by real artifacts, commits, PRs, tickets, delivery activity and agent output. Built for consistency and traceability.
Audit-ready reporting
Engineering evidence trails
Finance and compliance visibility
Cost attribution & allocation
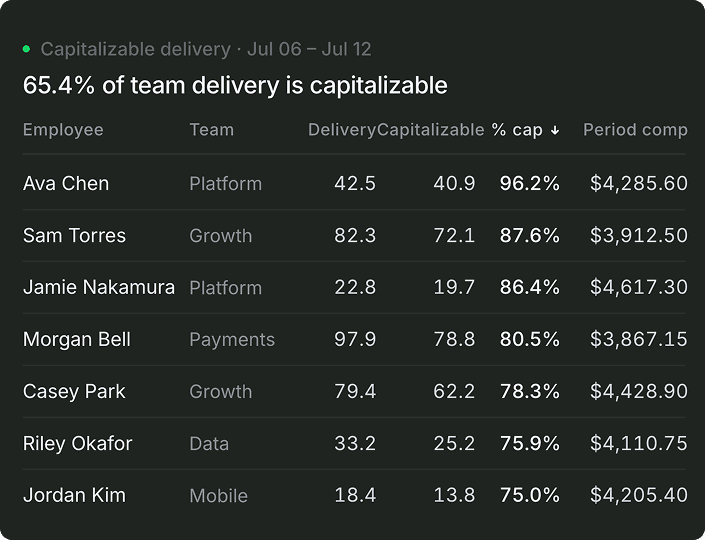
Know where the money goes
See how engineering investment distributes across projects, teams, features and maintenance including what you spend on agents and AI tooling, and what it returned per unit of delivered work.
Project and initiative cost allocation
Maintenance vs innovation breakdown
Human, agent and tooling investment visibility
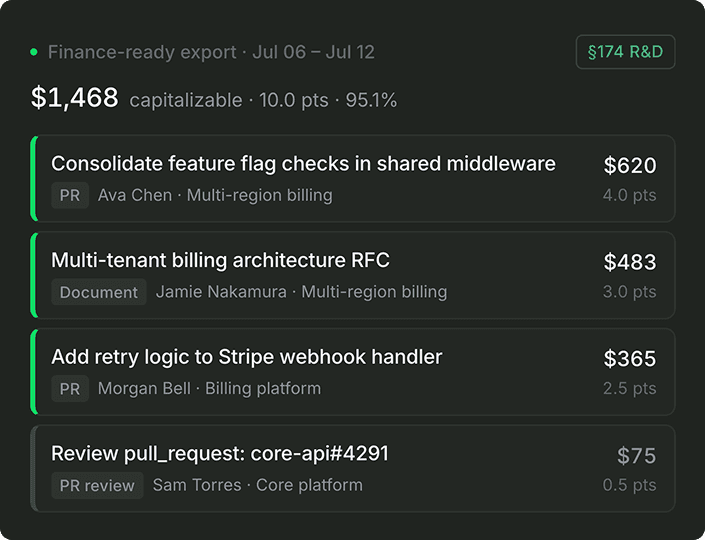
Finance-ready reporting
Reports CFOs actually trust
Turn delivery data into structured financial reporting, both human and agent, without asking engineering teams to change how they work.
CFO-ready reporting
Exportable finance reports
Continuous reporting visibility
"We went from 70% to 30% maintenance — it's where we want it to be."
Ignasi Vegas
Co-founder & CEO, Cubbo
"I'll pay for every AI tool you want. What I ask in return is: show me how you're going faster."
Andrew Eye
CEO & Founder, ClosedLoop
Does Pensero replace our CPA or tax advisor?
Does this support both GAAP capitalization and Section 174 / 174A?
How does Pensero handle domestic vs foreign engineering costs?
How quickly can we start seeing useful data?