Total delivery
Exceeding
9,612
points shipped, QTD
+18% vs prev. period
Per headcount
Exceeding
54.0
avg pts per engineer
7.2× benchmark
PRs merged
Exceeding
2,847
across 178 engineers, QTD
+22% vs prev. period
Focus time
Watch
72%
of work week in deep work
-3% vs prev. period
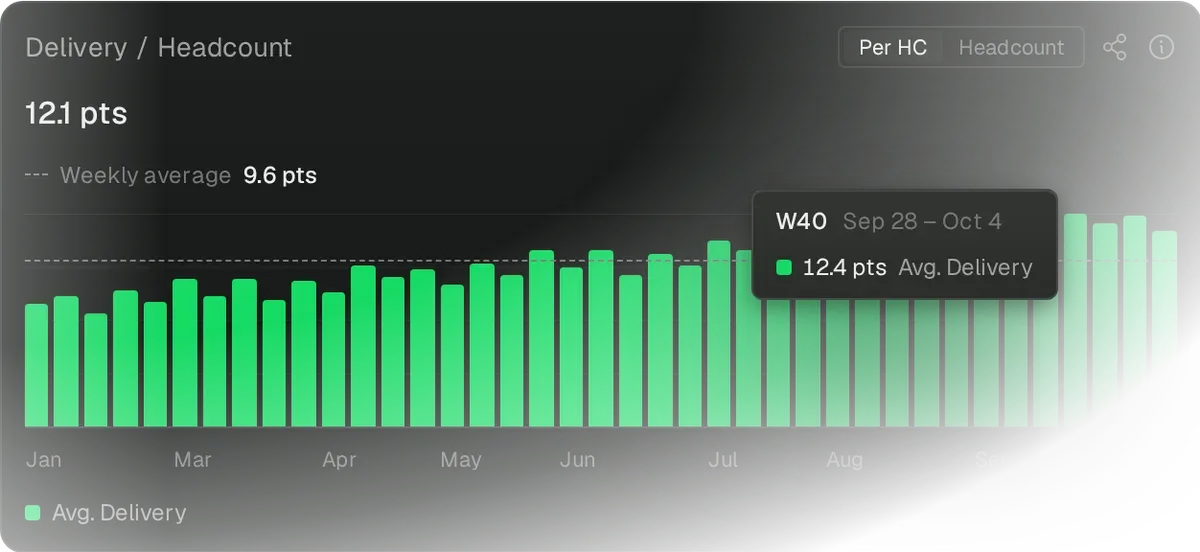
Delivery velocity climbing across the org
9,612 pts this quarter, +18% vs prior period
NovDecJanFebMarAprMay
DeliveryOOO lossPer HC trend
What delivery looks like
By contribution type, QTD
Pull requests
62.0%
Tickets
24.0%
Documents
9.0%
Communications
5.0%
2,847 pull requests merged · 1,204 tickets closed
Work
Epic
Team
Contributors
Pts
Integrate SSO with org-level alerts
Improvement
Auth & SSO
Engineering
MJ
SD
44.2
Attribute usage data to billing segments
Improvement
Billing
Engineering
CM
BL
39.5
OAuth token refresh failing on reconnect
KTLO
Engineering
PS
AK
SD
21.1
Support multi-region deployment config
New
Infrastructure
Platform
BL
MJ
19.6
Refactor webhook retry pipeline
Improvement
Integrations
Eng, Product
CM
PS
17.8
Team
Pts
/HC
Core Engineering
8,24046.3
Product & Design
74853.4
Platform
38664.3
Infrastructure
16254.0
Data
7638.0

Trusted by fast-growing companies around the world

Trusted by fast-growing companies around the world

Know what's actually shipping

Smart productivity scoring

Filter noise, measure value

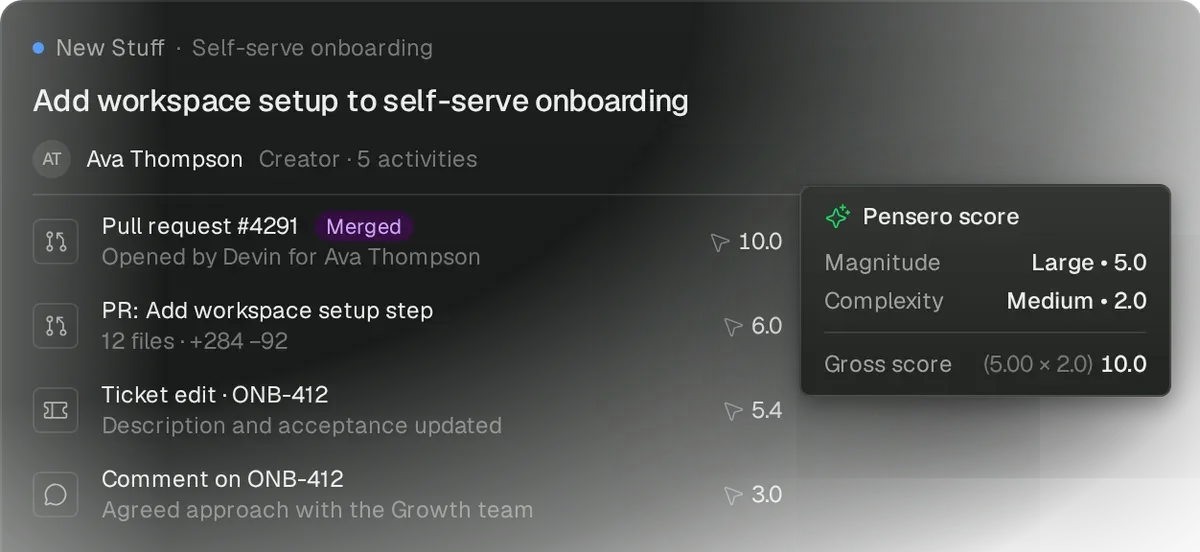
Go beyond PR volume. Measure the magnitude and complexity of what's actually shipped, not boilerplate and repetitive changes.

Magnitude and complexity scoring

Business value measurement

Boilerplate filtering

Scope of work breakdown

See where effort actually goes

Break down engineering work across features, tech debt, bugs, maintenance, and AI initiatives. Know if capacity matches strategic priorities.

Work categorization

Engineering capacity allocation

Strategic initiative tracking

Work attribution & visibility

Credit the work that ships

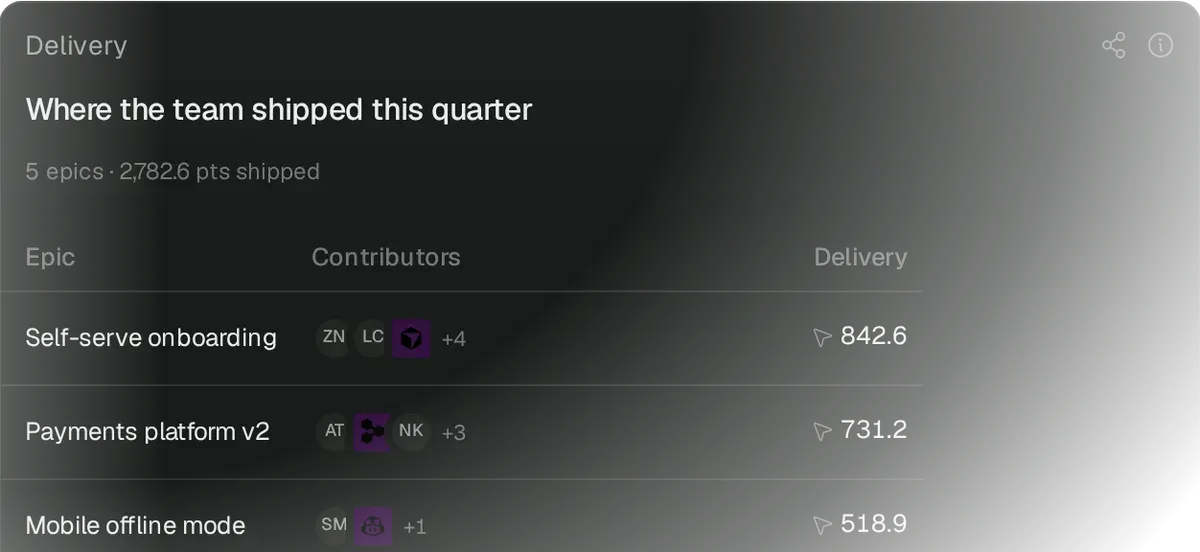
Connect contributions to projects and business outcomes. Surface the work that enables delivery, not just the code that's written.

Individual contribution visibility

Cross-team enablement

Business outcome attribution

Strategic alignment tracking

Build what matters most

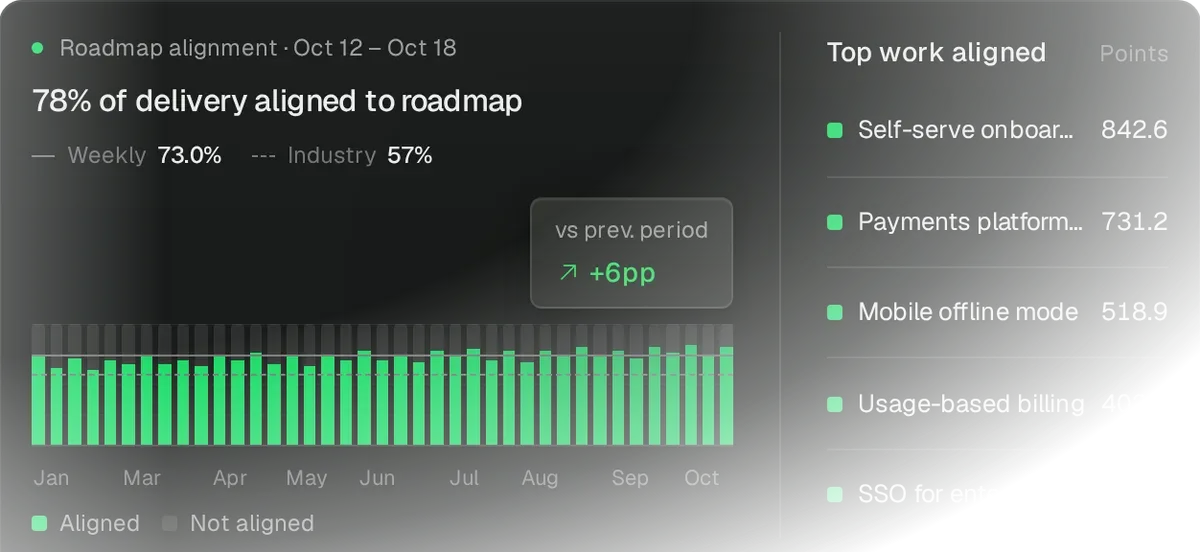
Connect engineering work to company objectives. See whether effort is focused on the projects that drive real business impact.

Initiative alignment

Delivery by objective

Strategic progress visibility

"It's the lighthouse of our engineering team."

Ignasi Vegas

CEO & Co-founder. Cubbo

Pensero is my compass in order to know where the team is heading to."

Jordi Miró

CTO, Zynap

Questions engineering leaders ask

How is this different from DORA or flow metrics?

Does this require my team to change how they work?

Can Pensero measure contribution that isn't code?

How quickly do we see useful signal?

See the product in action

See the product in action

Turn raw engineering
activity into actionable insight

Turn raw engineering
activity into actionable insight

Turn raw engineering
activity into actionable insight

Know what's working, fix what's not, and make
better decisions with confidence.

Know what's working, fix what's not, and make better decisions with confidence.