Talent & Benchmarking
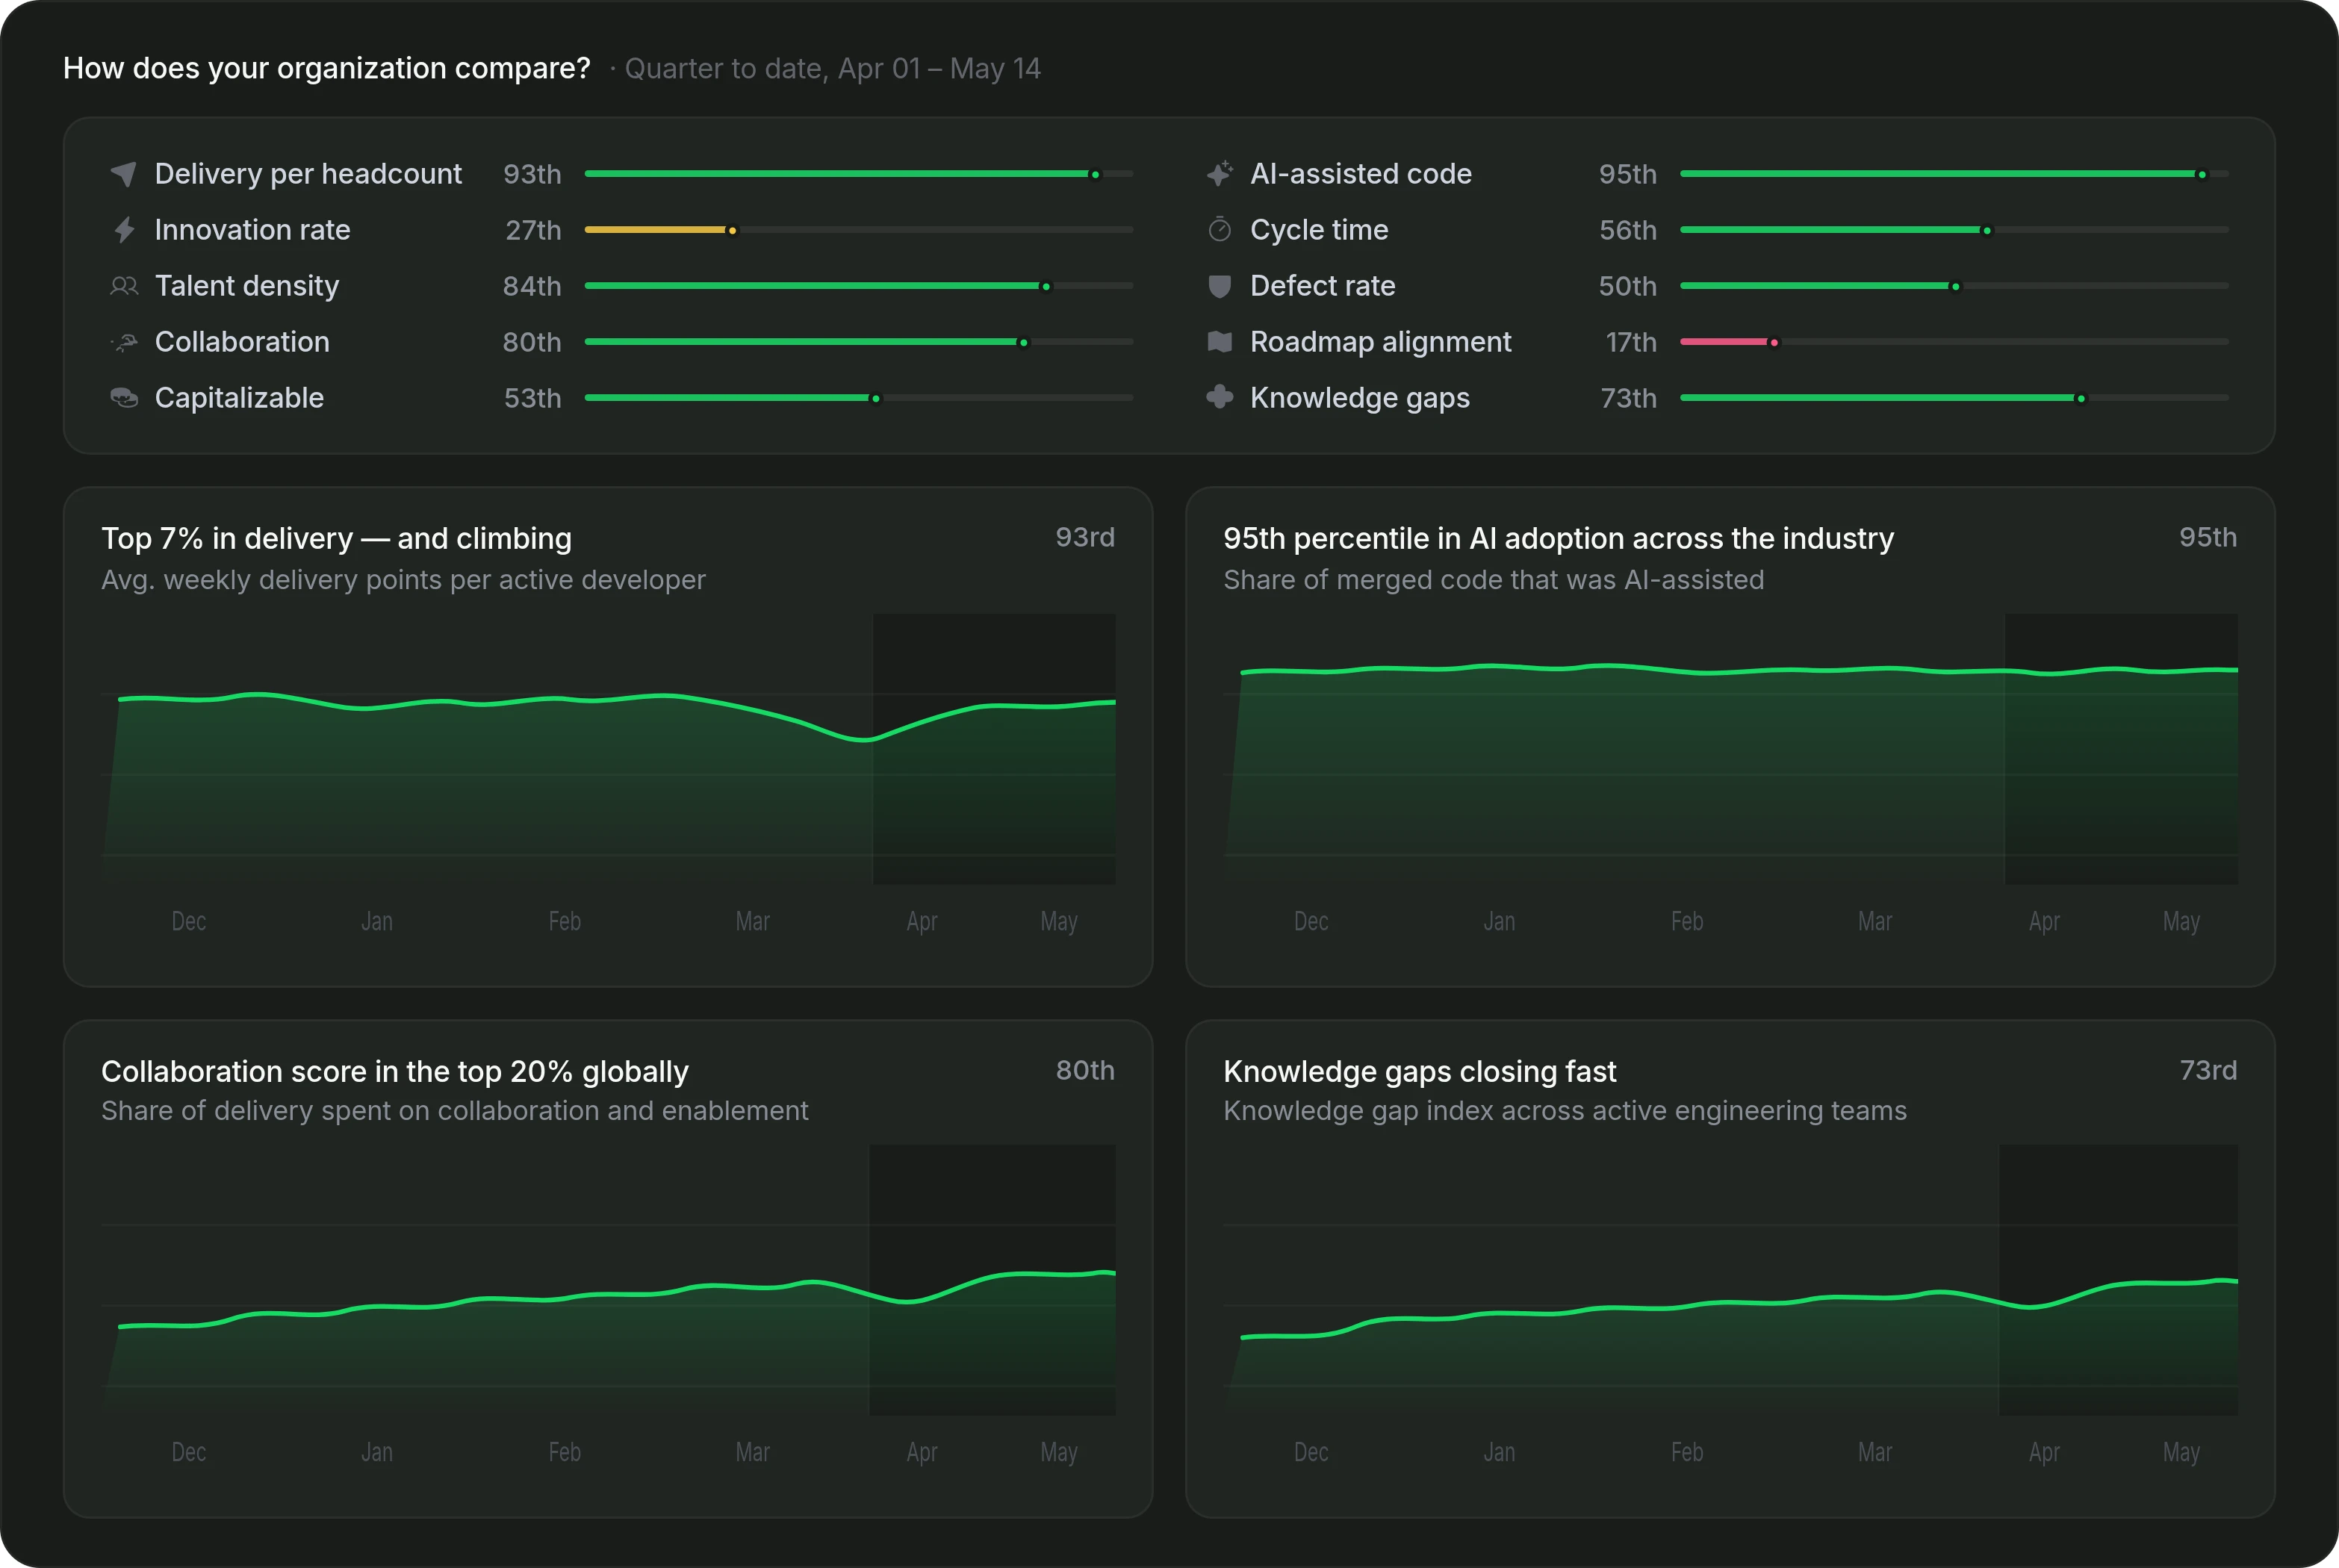
Internal trends only tell you whether you're moving. They don't tell you whether you're behind. Pensero puts any team, cohort or agent on one measurement framework and compares delivery, quality and cost per unit of work against real production data from other organisations.





Industry benchmark comparison
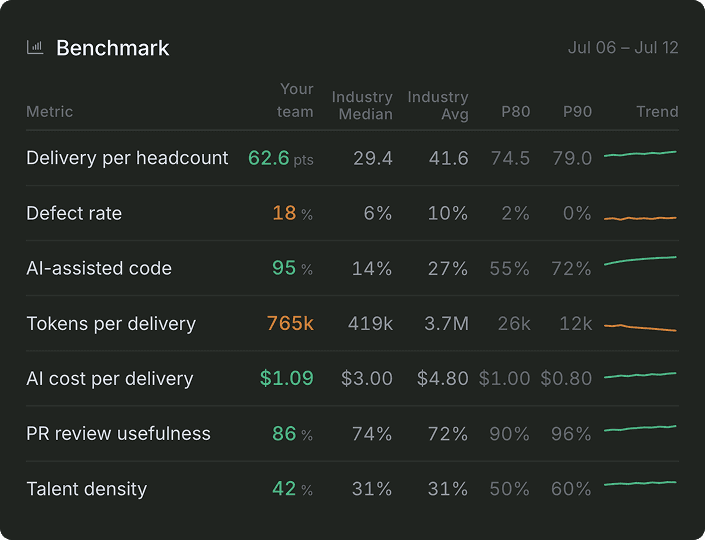
Benchmark against the industry
Compare delivery, quality, collaboration and cost per unit of work against industry peers, using anonymised production data from real organisations. Know whether your numbers are actually good, not just trending.
Industry percentile rankings
Delivery and quality benchmarks
AI and agent efficiency comparison
Team calibration & scoring
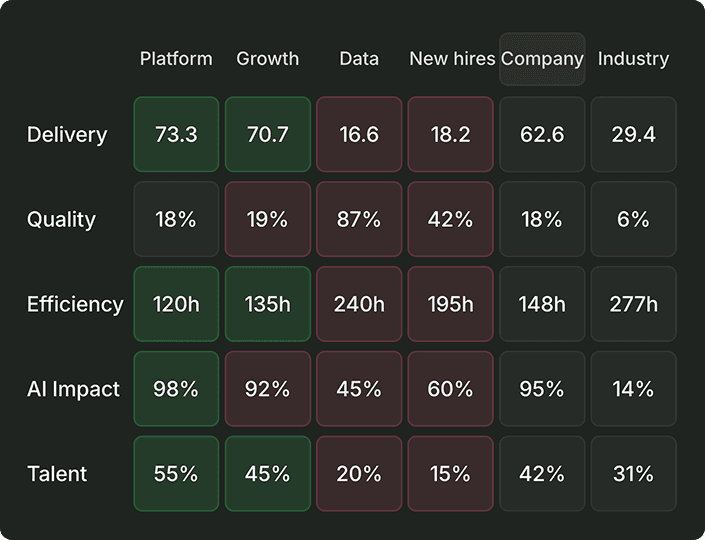
Compare teams, side by side
Put any agent, cohort or team on the same measurement framework. Same metrics, same scale, no separate ruler for agents that makes the comparison meaningless.
Cross-agent comparison
Delivery vs quality analysis
Collaboration and agent adoption patterns
Cohort comparison analysis
One framework, every group
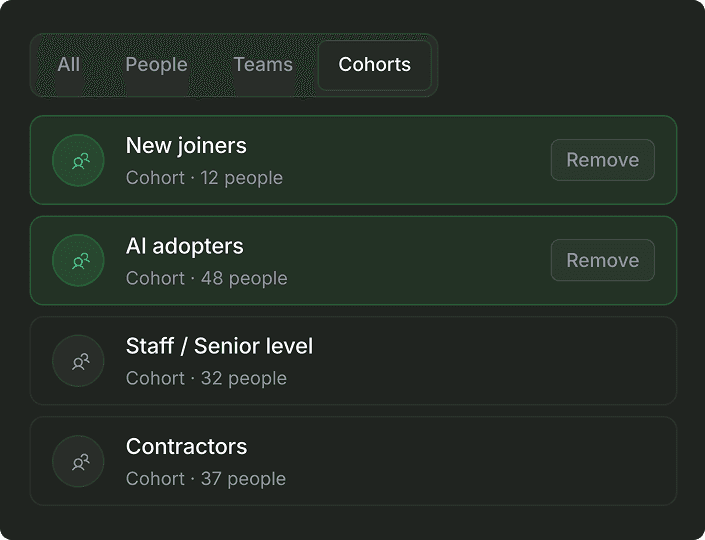
Compare by role, level, tenure, location or agent adoption. Surface patterns that org charts and reporting lines fail to reveal.
Dynamic cohort creation
AI adopters vs non-adopters
Organizational pattern analysis
Agents in context
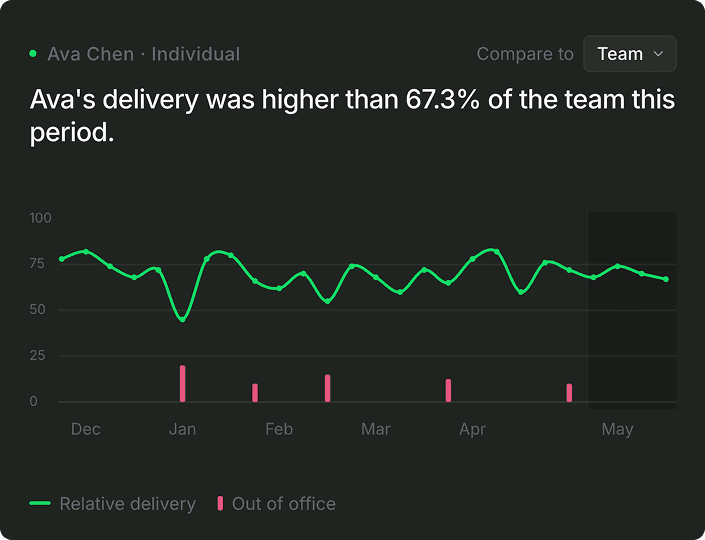
See every person in context
Compare agentic and AI-assisted delivery against human delivery, adjusted for meeting load, out-of-office and peer context, so the people who mentor and unblock aren't penalised for it.
Peer group benchmarking
Custom group comparisons
Percentile progress
"Pensero is why you want to work here."
Andrew Eye
CEO & Founder, ClosedLoop
Can I compare more than just teams?
How is this different from standard engineering metrics tools?
How do you account for teams working on different complexity levels?
Can I measure the impact of AI adoption?
Is Pensero only for engineering managers?