




Adoption & usage tracking
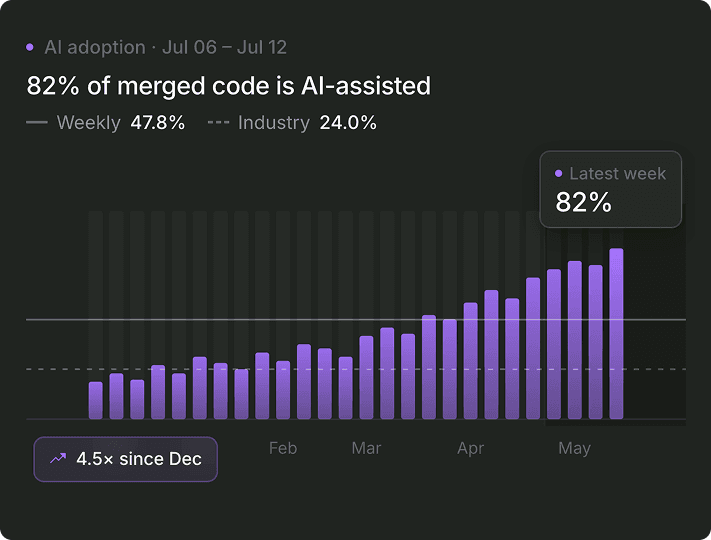
Track adoption, everywhere
Teams, repos, workflows. See which assistants and agents are in use, read from telemetry rather than from a survey, and where adoption is stalling.
Adoption across teams and agents
Usage trends over time
Tool and agent comparison
Efficiency metrics
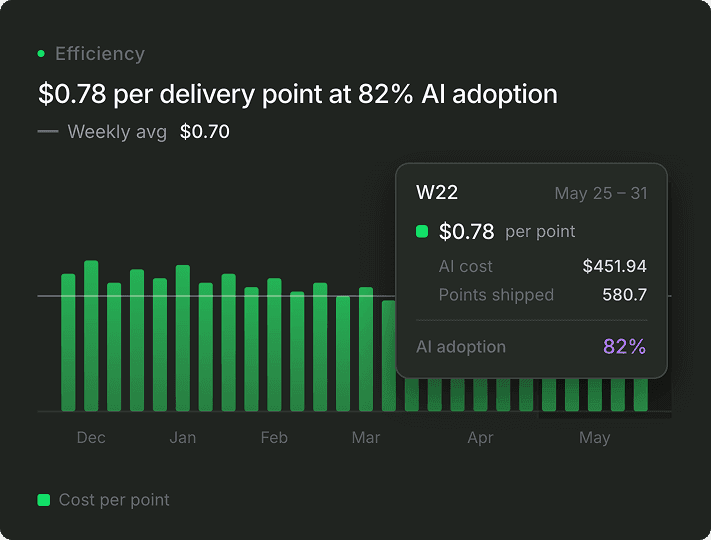
Cost per unit of work, measured
Tokens per unit of work, cost per team, cost per agent. Connect AI and agent spend to what actually shipped, and see whether the model in use fits the work it's doing.
Tokens per unit of work
Cost per unit of work
Model fit: right model, right task
Productivity impact
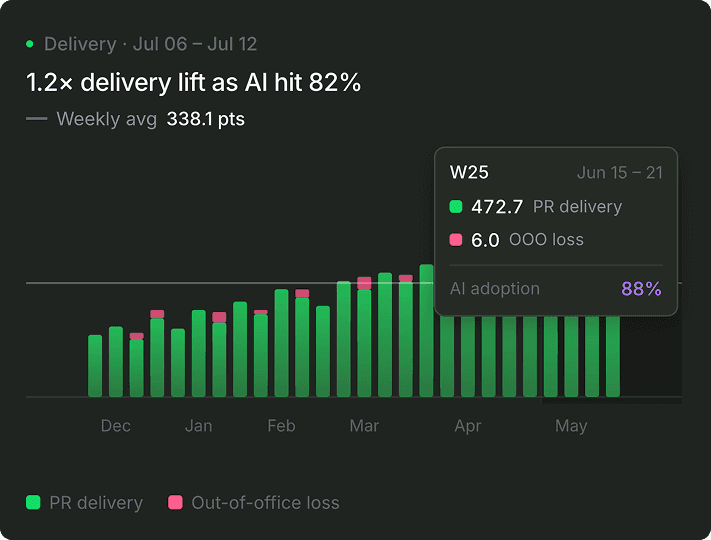
Separate signal from noise
Connect AI and agent usage to delivered output, weighted by magnitude and complexity. A hundred trivial changes and ten hard ones are not the same quarter. Weighting is what separates more activity from more output.
Delivery before and after AI
Productivity improvement analysis
Human, AI-assisted and agent contribution
Quality analysis
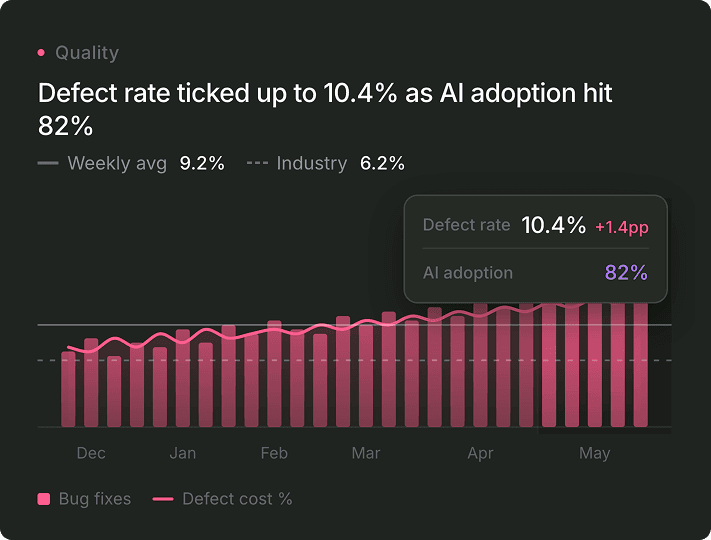
Faster doesn't mean fragile
Compare human, AI-assisted and agent-written code across defects, maintainability and rework, traced back to whatever produced it. Find out whether the speed is real or borrowed.
Agent vs AI-assisted vs human quality
Defect and rework attribution
Quality trends over time
"I can see the impact that AI is having on productivity… how much it influences the code that we're producing."
Jordi Miro
CTO, Zynap
"I'll pay for every AI tool you want. What I ask in return is: show me how you're going faster."
Andrew Eye
CEO & Founder, ClosedLoop
Does Pensero measure AI impact or just AI usage?
How is this different from per-tool AI adoption dashboards?
How does Pensero separate AI's contribution from normal team improvement?
How quickly can we start seeing useful data?