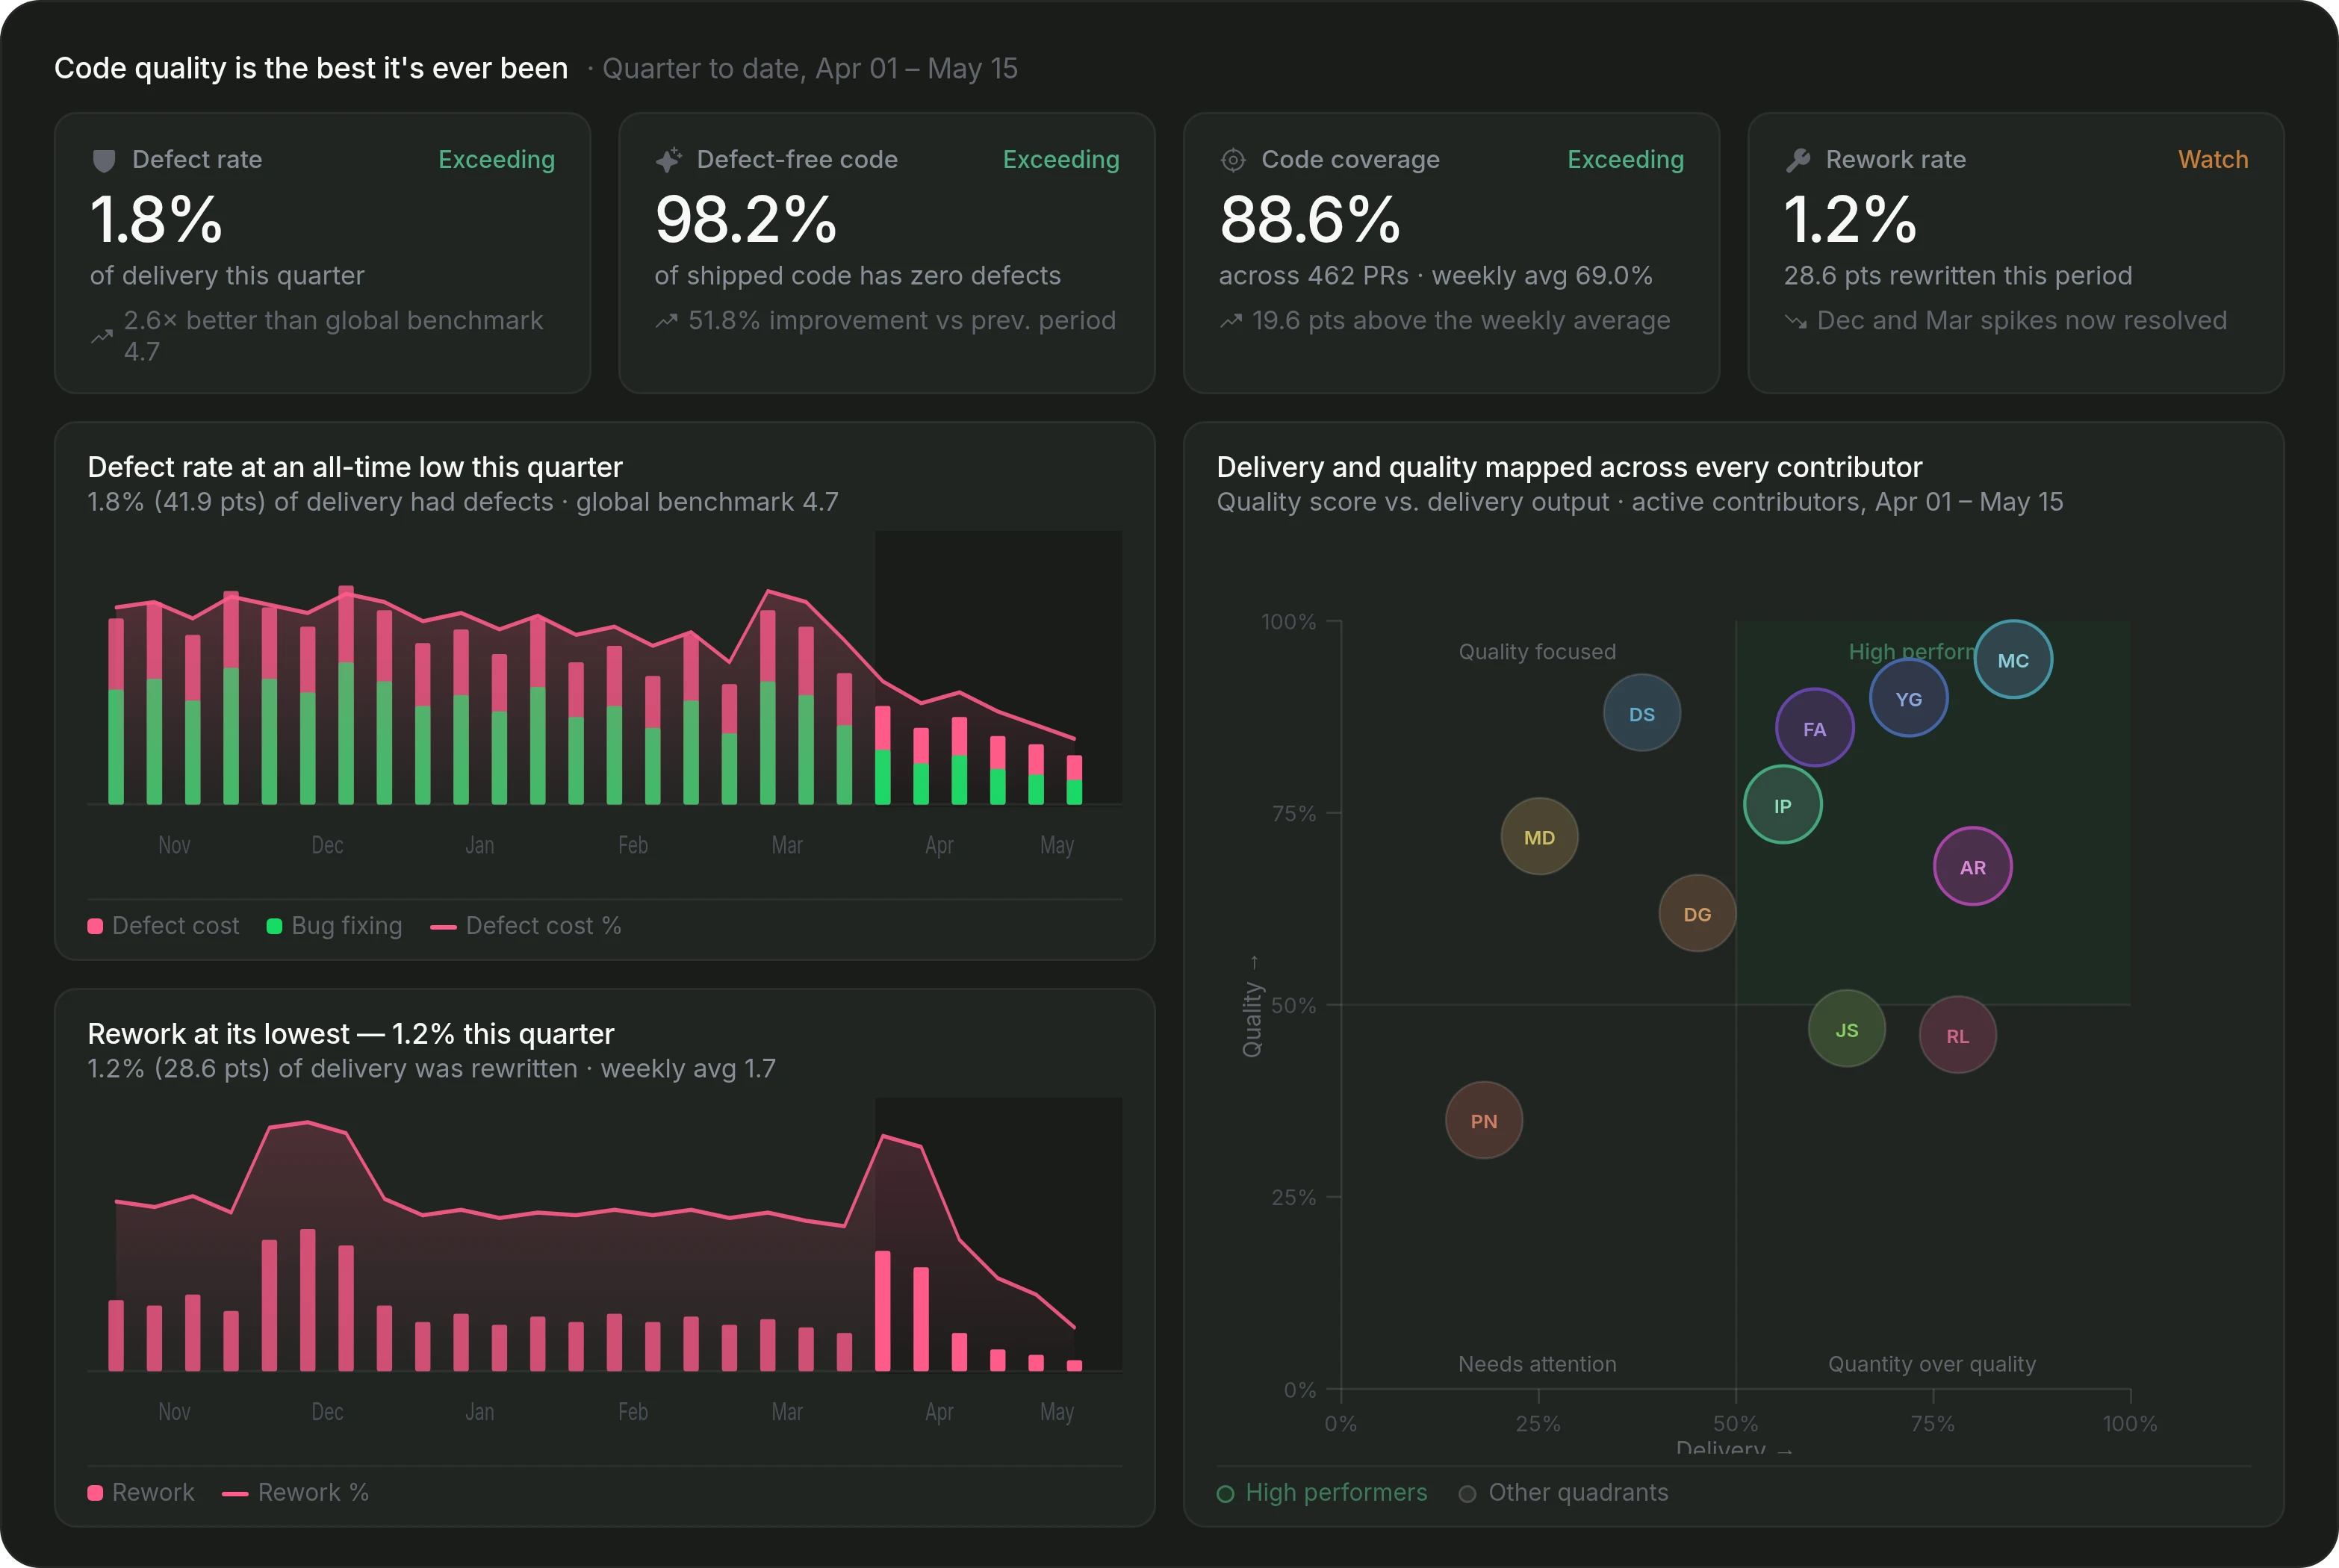
Ship cleaner code
Agent-authored pull requests arrive faster than humans can read them. The work didn't disappear, it moved, and it's now sitting with your senior engineers. Pensero shows what that speed costs in defects, rework and review load, traced back to whatever produced it.





Defect analysis & tracking
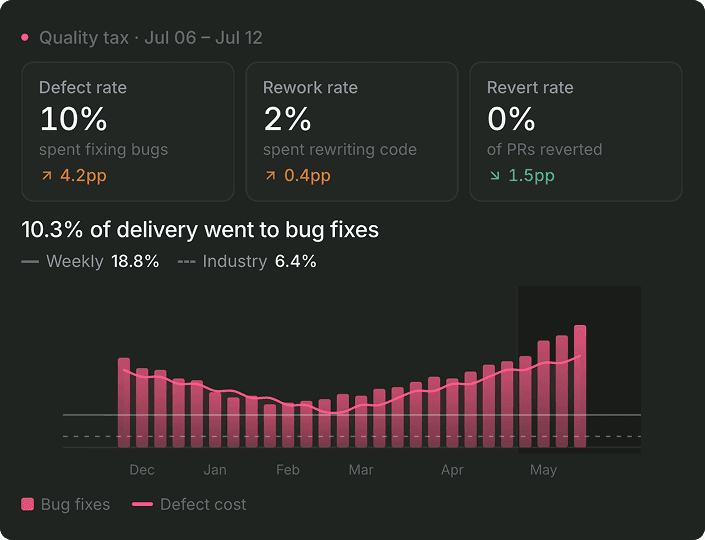
Find the patterns behind bugs
Pensero measures defect cost, the share of delivery spent fixing earlier work, and attributes it to the change that introduced it. Including agent work directed by a human.
Defect trends by team and repository
Root cause and source attribution
Quality hotspots across the organization
Rework measurement
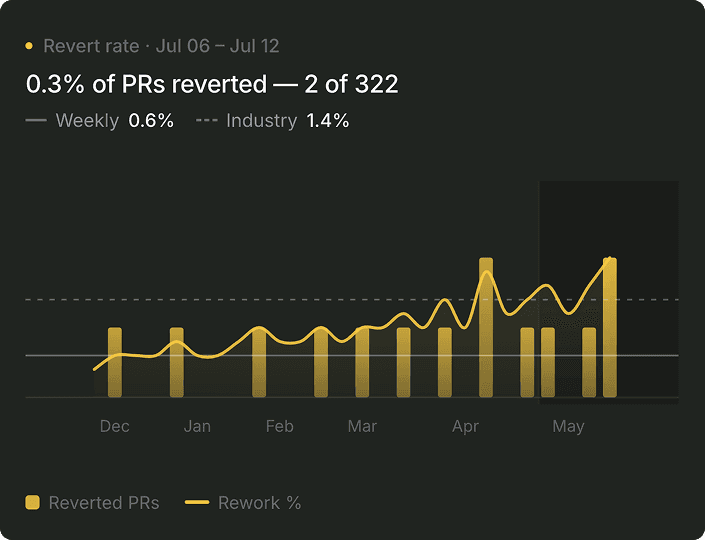
Measure the cost of fixing
Quantify how much capacity goes to rework, reverts and maintenance instead of new value. Learn how much of your AI and agent spend produced work that had to be redone.
Rework vs new development
Rework and revert attribution
Engineering capacity allocation
PR review depth & thoroughness
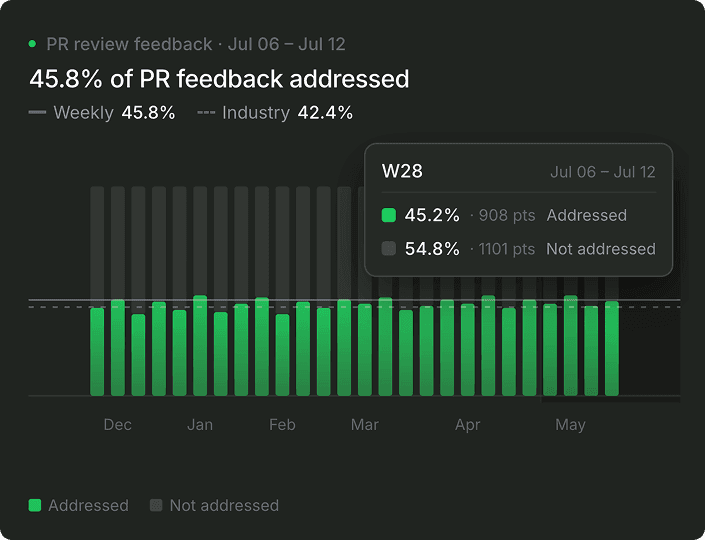
Review load is the hidden cost of speed
As agents generate more pull requests, senior engineers absorb the review. Pensero measures that load as what it is: delivery capacity spent on someone else's output. Depth and validation, not just participation counts.
Review depth analysis
Reviewer usefulness, not just participation
AI and agent code validation
Collaboration networks & knowledge sharing
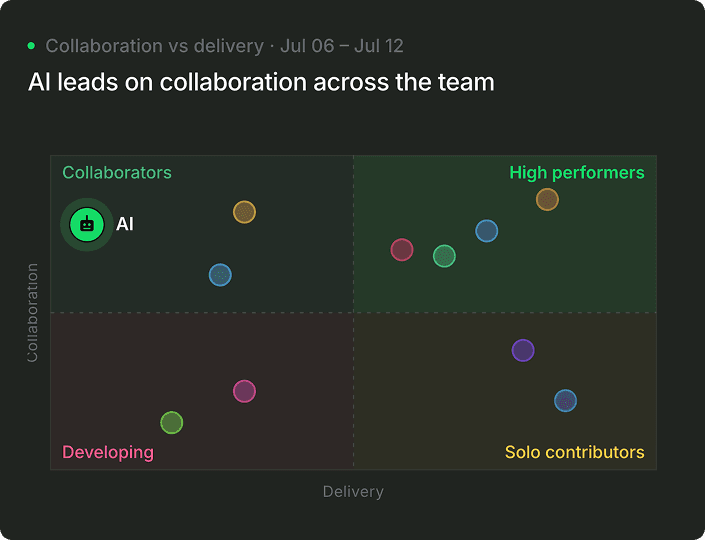
Where humans and agents collide
Map who reviews whose code, where knowledge flows, and whether agent-generated code gets appropriate human validation.
Collaboration network visualization
Knowledge-sharing patterns
Human oversight of agent-generated code
"Maintenance work reduced from 70% to 30% as quality and focus improved."
Ignasi Vegas
Co-Founder & CEO, Cubbo
How is this different from static analysis or code-quality scanners?
Can Pensero tell whether AI-generated code is being properly reviewed?
Does measuring rework and review depth add process for my engineers?
Why does complexity-aware measurement matter for quality?