Benchmarking

Compare teams, providers, agents
and models on the same work

Pensero puts every team, provider, agent and model on one scale and compares delivery, quality and cost per point against the market.

The Delivery Point™. Used at 200+ organizations.

  • Internet Brands
  • WebMD
  • Perk
  • ClosedLoop
  • Stord
  • Tuio
  • Persuit
  • SEAT CODE
  • Elfie
  • Caravelo
  • ShopMy
  • iAhorro
  • Hum Capital
  • Exoticca

Compare on one scale

Evaluate external providers like your own teams

Score outsourced work with the same criteria as in-house work. Compare providers on delivery points, cost per point and quality, and see what you get for your money.

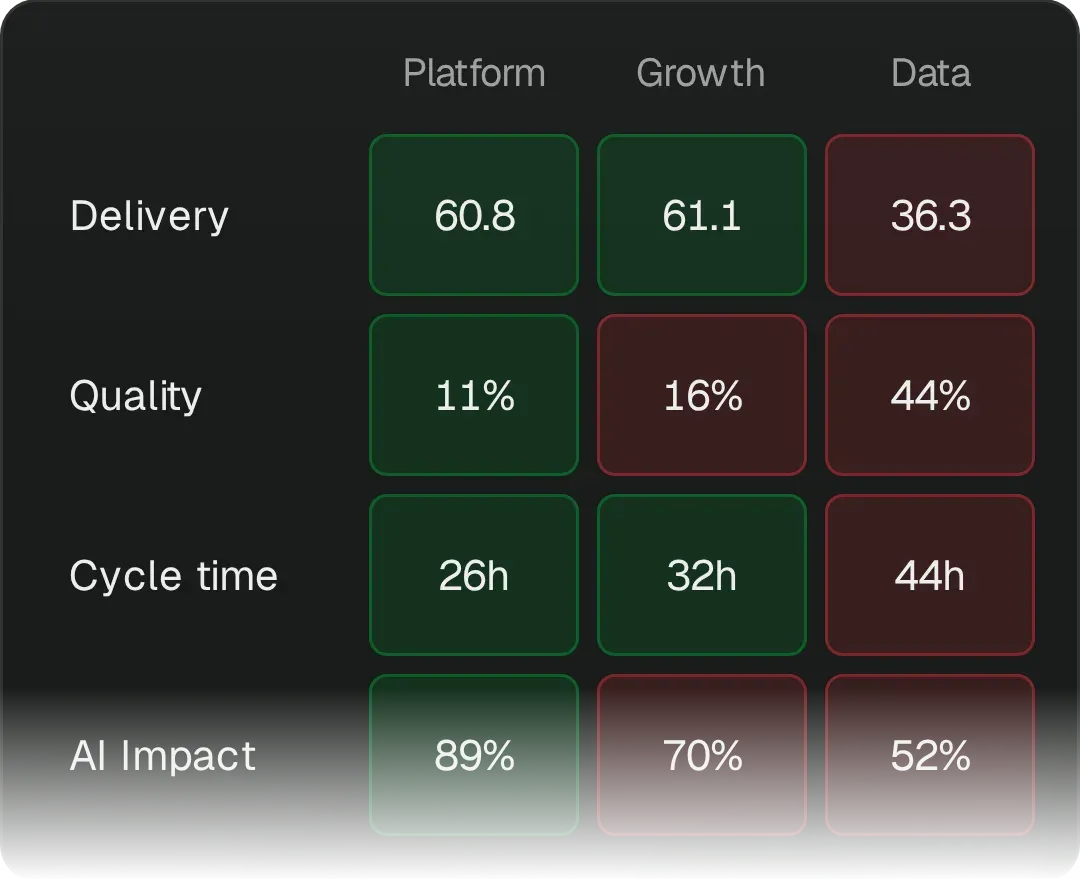
Pensero Calibrate matrix with example data: delivery points per headcount, defect cost, PR cycle time, AI user adoption and talent density for 4 teams, the company and the industry. Company against industry: Delivery 57.4 against 55.9, Quality 15% against 18%, Cycle time 34h against 41h, AI Impact 71% against 54%. The Data and New hires teams are worse than the company on every row, the AI adopters and Staff+ teams are better.

Benchmark against similar organizations

Delivery points, quality and cost per point compared with similar organizations, using anonymized production data from 6,000+ developers in 200+ organizations. A benchmark gives context. It does not set a fair price.

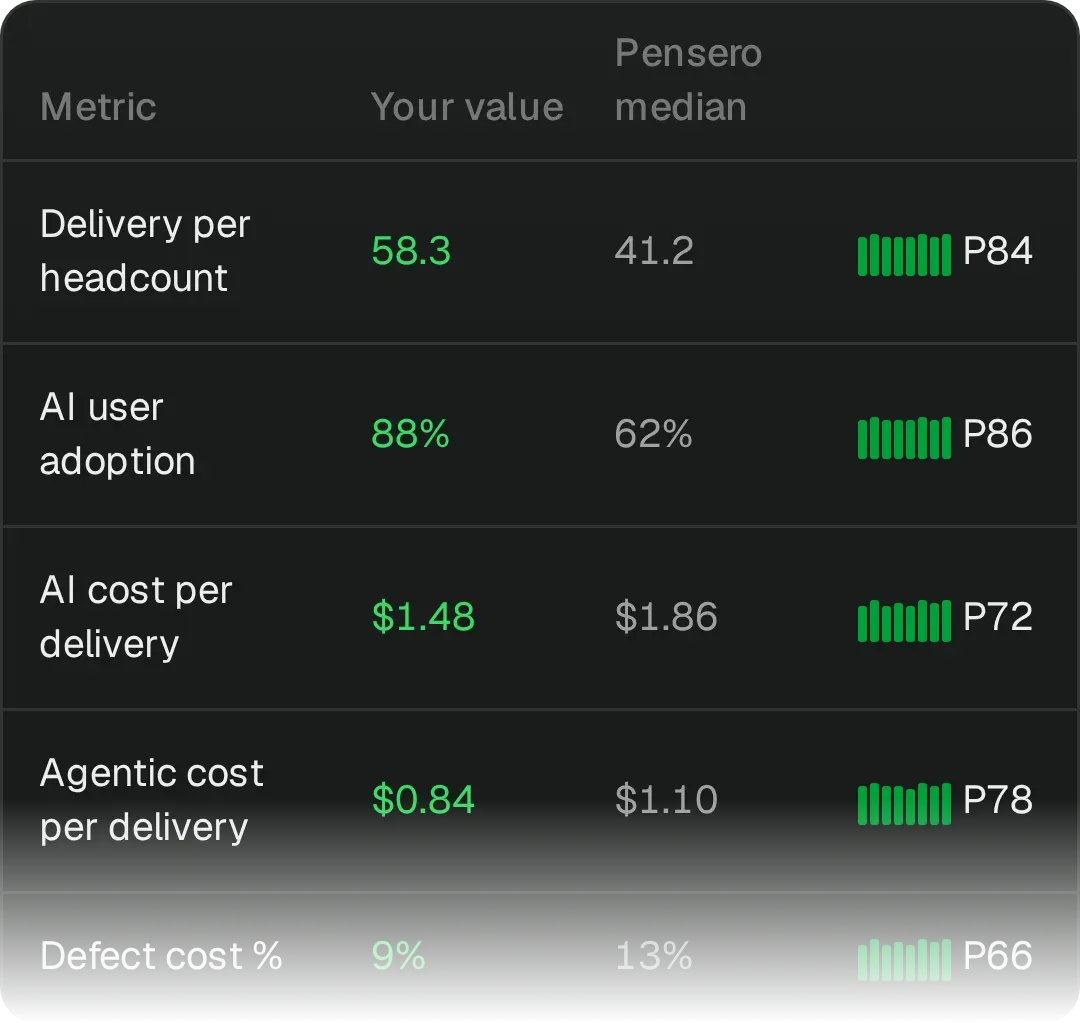
Pensero Benchmark table with example data: delivery per headcount, AI user adoption, AI and agentic cost per delivery, defect cost, cycle time and roadmap alignment, each against the Pensero median, with your percentile.

Compare agents and models side by side

Any agent, model or team on the same framework and scale, so the comparison means something.

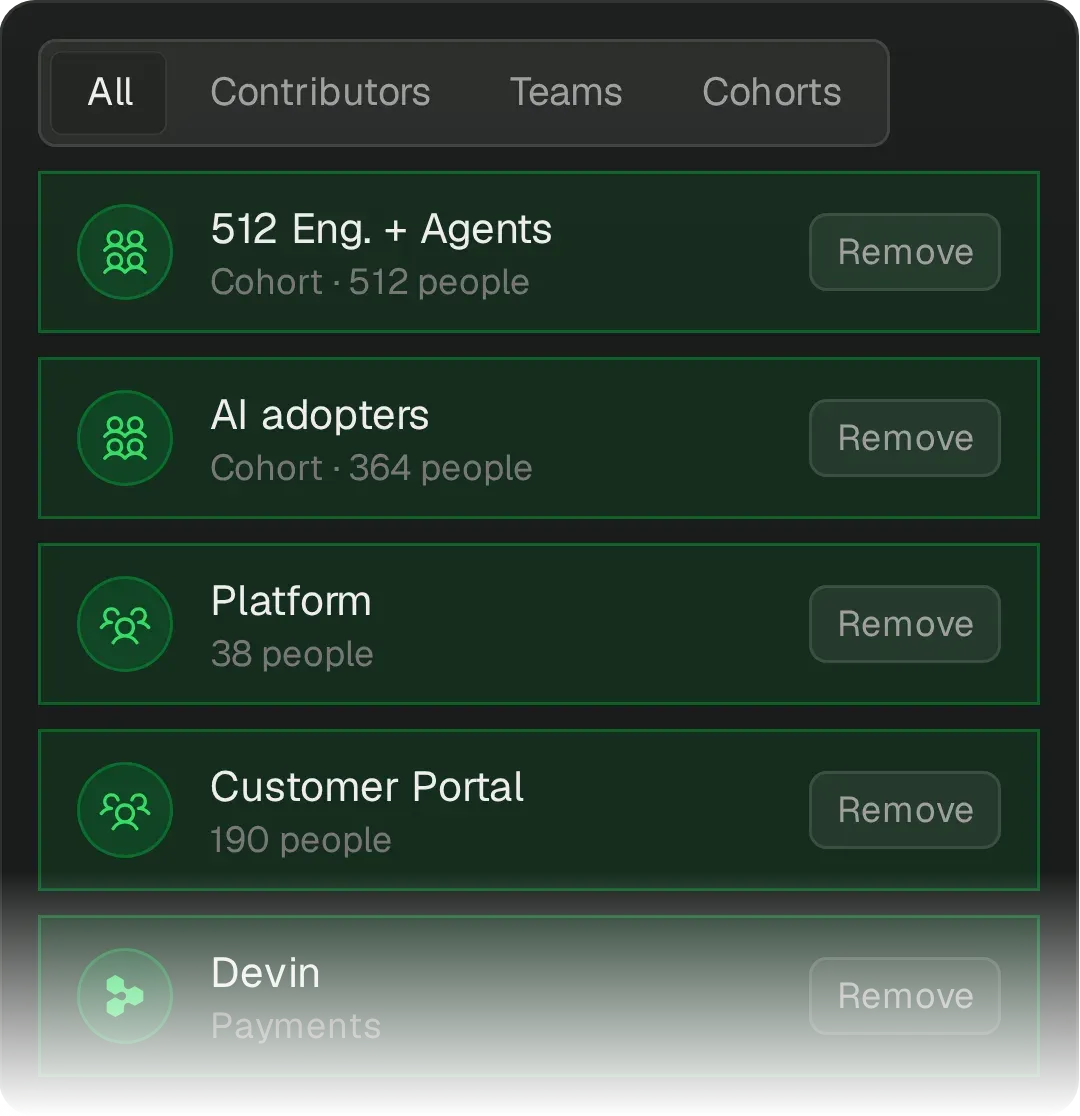
Pensero scope selector with example data, All tab: 512 Eng. + Agents, AI adopters, Platform, Customer Portal, Devin are selected, so cohorts, teams and an agent are on the same metrics.

See every team in context

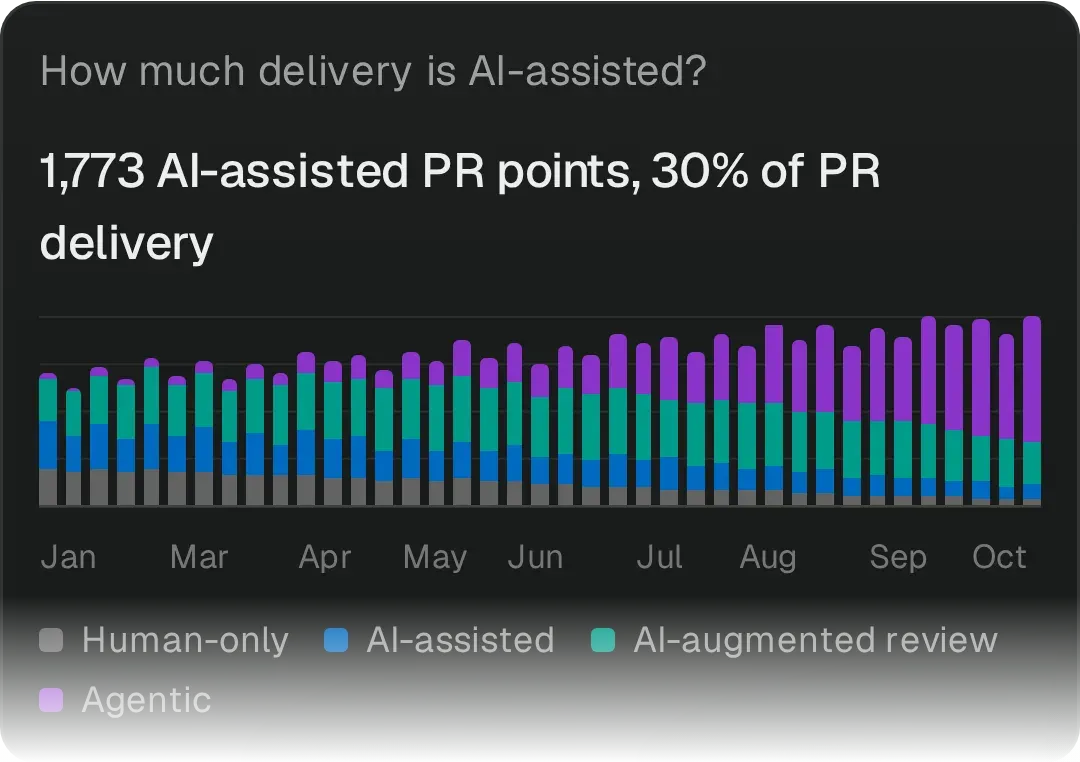
Compare agentic, AI-assisted and human delivery, adjusted for meeting load, time off and the work of mentoring and unblocking.

Pensero AI delivery chart with example data: weekly PR delivery points split into human-only, AI-assisted, AI-augmented review and agentic work. Agentic work grows from a small share in January to most of the delivery in October.
  • “One of the key signals was delivery points per headcount.”
    Justin NguyenDirector of Engineering, PersuitRead story →
  • “The goal is to help them learn what our best people are doing.”
    Andrew EyeCEO and Founder, ClosedLoopRead story →
  • “Pensero allows us to do it in a homogeneous way.”
    Jordi AbadCTO, SEAT CODERead story →
  • “We need a way that is objective to see that we’re increasing productivity.”
    Jordi AbadCTO, SEAT CODERead story →
  • “I go every morning into the email, check the first KPIs and drill down.”
    Jordi MiróCTO, ZynapRead story →

Questions teams ask

Can I compare more than teams?

Yes. Build groups by role, location, employment type, provider, agent or AI adoption and compare any of them on the same scale. Pensero compares groups and types of work, not individual people.

How is this different from standard engineering metrics tools?

Standard tools report activity and flow. Pensero scores what was actually delivered and weights it by difficulty, so teams shipping fewer, harder changes are not penalized.

How do you account for teams working on different levels of difficulty?

Pensero weights each unit of work by size and difficulty, so high volume is not mistaken for high value and comparisons stay fair.

Can I measure the impact of AI adoption?

Yes. Pensero compares AI adopters with non-adopters and connects AI use to delivered value and quality, by team or group.

Is Pensero only for engineering managers?

No. Pensero serves engineering leaders, finance, procurement and executives who need objective numbers for planning, benchmarking, provider decisions and strategy.

How do we start?

With a 6-week audit: your position against similar organizations and a plan per team. We scope it in a 30-minute session.